
Darcy-Weisbach Formula
Enroll to start learning
You’ve not yet enrolled in this course. Please enroll for free to listen to audio lessons, classroom podcasts and take practice test.
Interactive Audio Lesson
Listen to a student-teacher conversation explaining the topic in a relatable way.
Introduction to Pipe Flow and Energy Losses
🔒 Unlock Audio Lesson
Sign up and enroll to listen to this audio lesson

Today, we'll discuss the Darcy-Weisbach formula, critical for designing pipe systems; can anyone tell me what energy loss means in this context?

Isn't it how much energy is lost when water flows through pipes?
Exactly, it's the energy that gets dissipated due to friction as the water moves. We often refer to this as head loss.

What factors influence this head loss?
Great question! Key influences include pipe diameter, length, roughness, and flow characteristics. Remember the acronym DRLF: Diameter, Roughness, Length, Flow conditions.

So, if I have a longer pipe, will it cause more head loss?
Yes, longer pipes lead to higher energy losses. Let's summarize: head loss is affected by the pipe's diameter, length, roughness, and the flow's characteristics.
Understanding the Darcy-Weisbach Equation
🔒 Unlock Audio Lesson
Sign up and enroll to listen to this audio lesson

Now, let's look at the Darcy-Weisbach formula. It states: $$h_f = f \frac{L}{D} \frac{\rho v^2}{2g}$$. Who can explain what each term represents?

Uh, $h_f$ is the head loss, $L$ is the length, $D$ is the diameter, and $v$ is the flow velocity right?
Spot on! And what about $f$?
Is it the friction factor, which depends on Reynolds number and roughness?
Correct! The friction factor $f$ varies with flow conditions, and we need to know how to determine it from experiments. Remember, friction increases with surface roughness!
What happens if the pipe is smooth?
In smooth pipes, there's less turbulence and consequently less energy loss. Let’s recap: the Darcy-Weisbach formula describes how different parameters impact head loss.
Friction Factors and Their Importance
🔒 Unlock Audio Lesson
Sign up and enroll to listen to this audio lesson
Who can explain what friction factors are and why they're important?
Friction factors help quantify energy losses in pipes based on flow conditions and surface texture?
Yes! They’re essential for using the Darcy-Weisbach formula effectively. We often get these factors from experimental data, like Nikuradse’s experiments!
What is the Moody chart then?
Great connection! The Moody chart is a graphical representation that helps you find friction factors based on Reynolds number and relative roughness.
Can it keep us from doing so many experiments?
Exactly! It saves time and resources by allowing quick estimates of friction factors. Let’s summarize: friction factors are pivotal in head loss calculations, derived from experimental results or charts.
Introduction & Overview
Read summaries of the section's main ideas at different levels of detail.
Quick Overview
Standard
This section discusses the Darcy-Weisbach formula, which calculates energy losses in pipe systems. It delves into the importance of understanding head loss and the variables affecting it, including pipe diameter, length, roughness, and flow conditions such as Reynolds number. The significance of friction factors, determined through experiments, is also highlighted.
Detailed
Detailed Summary
The section explores the Darcy-Weisbach formula, fundamental for understanding energy losses due to friction in pipe flow systems, particularly in complex water supply networks.
Key Concepts Discussed:
1. Energy Loss in Pipe Flow: The essence of analyzing how energy loss occurs within different sections of a pipe network, facilitating the assessment of flow availability.
2. Head Loss and Bernoulli’s Equation: Exploring head loss from the viewpoint of Bernoulli’s equation helps in understanding how energy varies within the system under steady-state conditions.
3. Flow Characteristics: The behavior of turbulent flow is key, which requires other dependent variables such as average pressure and velocity, along with smoothness or roughness of the pipe surface which directly influences energy dissipation.
4. Dimensional Analysis: Critical to understand how variables like pipe diameter, length, viscosity, and average velocity relate to one another in characterizing fluid flow.
5. Friction Factors: Derived from experimental data through various flow conditions and pipe roughness, these factors play a pivotal role in the simplified head loss calculation of the Darcy-Weisbach formula given as:
$$h_f = f \frac{L}{D} \frac{\rho v^2}{2g}$$
where $h_f$ is the head loss, $f$ is the friction factor, $L$ is pipe length, $D$ is diameter, $
ho$ is the fluid density, $v$ is the flow velocity, and $g$ is gravitational acceleration.
6. Nikuradse’s Data and Moody Chart: Highlighting experimental insights into how artificially roughened pipes behave under turbulent flow, along with practical applications of Moody charts in real scenarios.
In summary, the Darcy-Weisbach formula serves as a significant foundation for hydraulic design and analysis in engineering, emphasizing the imperative nature of experimental data in estimating head loss.
Youtube Videos


Audio Book
Dive deep into the subject with an immersive audiobook experience.
Understanding Pipe Systems and Energy Losses
Chapter 1 of 9
🔒 Unlock Audio Chapter
Sign up and enroll to access the full audio experience
Chapter Content
So what they did it that to design this pipe systems like for examples, we have a water supply systems, okay. So if you have a water supply systems, there could be a source and there could be the pipe network to different locations. There will be you can imagine it that can have a very complex pipe networks supplying to water to different locations. How to design these pipe networks.
Detailed Explanation
This introduction explains the importance of designing effective pipe systems, particularly for water supply. It emphasizes that these systems can be complex with many pipes connecting various sources to different destinations. Designing such systems involves understanding how to manage energy losses that occur as fluid flows through these pipes.
Examples & Analogies
Think of a network of roads connecting different towns. Just as cars can lose speed due to hills, bumps, or stop signs, water flowing through pipes also loses energy due to friction and other factors. Designing the road (or pipe) efficiently allows more cars (or water) to reach their destinations effectively.
Energy Losses and Head Losses
Chapter 2 of 9
🔒 Unlock Audio Chapter
Sign up and enroll to access the full audio experience
Chapter Content
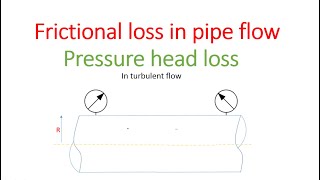
So now it is coming it that we can find out how much energy losses, how the head losses in the pipe flow systems. You can know the how much of energy loss is here, how much of energy loss is here, how much of energy loss is here, then I can quantify it the energy availability at different parts.
Detailed Explanation
This chunk discusses the concept of 'energy losses' in pipe flow, which refers to the loss of energy as water flows through the pipe. 'Head loss' specifically quantifies how much energy (or 'head') decreases due to factors such as friction against the pipe's walls. Understanding these losses is crucial for determining whether water will reach the desired locations.
Examples & Analogies
Imagine a water slide. As you go down, you might slow down at certain parts because of friction with the slide's surface. Similarly, in pipes, as water flows, it slows down due to 'friction' with the walls, leading to energy loss.
Turbulent Flow and Average Conditions
Chapter 3 of 9
🔒 Unlock Audio Chapter
Sign up and enroll to access the full audio experience
Chapter Content
Now we look it any turbulent flow going through a pipe systems then we can easily we can make it what are the governing or depending dependent variable components. Like I have a pipe. As I have the pipe part is going through these I have to look it the average conditions the time average P and time average velocity. So we talk about the time average or mean time average pressure component.
Detailed Explanation
This section introduces turbulent flow, which is when fluid flows chaotically rather than in smooth layers. When analyzing turbulent flow, it's important to consider average conditions, such as average pressure and velocity, because the flow can vary significantly. Doing so allows engineers to make predictions about the behavior of the fluid in the pipe.
Examples & Analogies
Think of a busy highway during rush hour. Cars are moving in different speeds and sometimes bumper-to-bumper. To understand traffic flow, we often look at average speeds rather than individual car speeds. Similarly, in fluid dynamics, we analyze average properties to understand the overall behavior of turbulent flow.
Dimensional Analysis for Friction Losses
Chapter 4 of 9
🔒 Unlock Audio Chapter
Sign up and enroll to access the full audio experience
Chapter Content
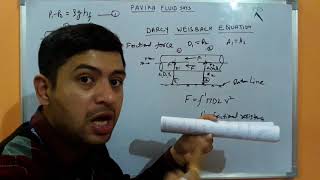
Now let us now what we are doing it first the dimensional analysis. So if there is a pressure drop along a pipe in a turbulent flow depends upon the following quantities. Pipe diameters, length of the pipe okay diameters, the length of the pipe is similar to the coefficient of viscosity, familiar to the coefficient of viscosity and average velocity rho and the small e represents the average variations in pipe radius.
Detailed Explanation
Here, the text discusses how pressure drop in turbulent flow can be understood by analyzing various factors, including pipe diameter, pipe length, viscosity, velocity, and roughness. Dimensional analysis allows engineers to create relationships between these factors to predict pressure drops accurately.
Examples & Analogies
Imagine a garden hose. The diameter of the hose and how long it is will affect how quickly water comes out. Similarly, in a pipe, these factors influence how pressure and flow behave. Analyzing these helps ensure that systems function correctly.
Roughness and Its Effects on Flow
Chapter 5 of 9
🔒 Unlock Audio Chapter
Sign up and enroll to access the full audio experience
Chapter Content
If you look at the pipe the different pipe will have a different roughness like this glass surface maybe looks for me is a smooth surface. But if you look at microscopically there is a roughness is there. That means if I take the surface for my hand it may looks like a smooth surface, but microscopically if I look it there is a roughness is there.
Detailed Explanation
This excerpt highlights that even seemingly smooth surfaces have microscopic roughness that can affect fluid flow. The roughness of pipes can enhance turbulence, thereby increasing energy losses due to friction. Acknowledging this factor is essential in the design of piping systems.
Examples & Analogies
Think about a mountain road. While it may look smooth to the eye, up close, there are bumps and grooves. Cars moving over these uneven surfaces experience more friction, affecting speed. Similarly, pipes with rough surfaces cause water to experience more friction and turbulence.
Deriving the Darcy-Weisbach Equation
Chapter 6 of 9
🔒 Unlock Audio Chapter
Sign up and enroll to access the full audio experience
Chapter Content
So if you know these function, then the head loss which is the Darcy-Weisbach formula is this part, which is simple part, okay. It is easy to remember it. It is that the head loss will be, \(h_f = f \frac{L}{D} \frac{v^2}{2g}\) where \(f\) is the friction factor, \(L\) is the length of the pipe, \(D\) is the diameter, and \(v\) is the average velocity.
Detailed Explanation
The Darcy-Weisbach equation provides a straightforward way to calculate head loss in pipes due to friction. The formula incorporates various factors: the length and diameter of the pipe, the fluid's velocity, and a friction factor that accounts for the roughness of the pipe. Understanding this equation is integral for engineers when designing pipe systems.
Examples & Analogies
Consider using a straw to drink a smoothie. The length of the straw, its diameter, and how hard you suck (to create velocity) all affect how fast the smoothie comes to your mouth. Similarly, the Darcy-Weisbach equation helps quantify how well fluid moves through pipes based on various parameters.
Laminar Flow Behavior
Chapter 7 of 9
🔒 Unlock Audio Chapter
Sign up and enroll to access the full audio experience
Chapter Content
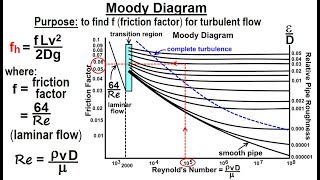
For the laminar flow, what it is found it the friction factor is a just a inversely proportional to the Reynolds numbers and the constants is becomes 64. This is experimental finding with a conducting a series of experiment in pipes.
Detailed Explanation
In laminar flow, friction factor behaves differently compared to turbulent flow. It is inversely proportional to Reynolds number, meaning as the Reynolds number increases (indicating a more turbulent flow), the friction factor decreases. This relationship helps in predicting how fluid behaves in pipes under laminar conditions.
Examples & Analogies
Imagine a gentle stream of honey pouring from a jar. The smoother the flow, the easier it moves. But if you shake the jar too much (like increasing Reynolds number), it'll splash everywhere, making it messier. This illustrates how a smooth flow can switch to a turbulent one based on conditions.
Nikuradse's Experimental Findings
Chapter 8 of 9
🔒 Unlock Audio Chapter
Sign up and enroll to access the full audio experience
Chapter Content
Now we will talk about the Nikuradse’s data for artificial roughened pipes which he conducted a series of experiments and this x axis if you look it is a Reynolds numbers and the y axis is a friction factors, the Reynolds numbers in a log scale okay.
Detailed Explanation
Nikuradse conducted experiments on artificially roughened pipes, analyzing how friction factors change with varying Reynolds numbers. His findings were plotted to illustrate how friction factors relate to flow characteristics in different conditions, contributing significantly to pipe flow studies.
Examples & Analogies
Think of a scientist experimenting with sandpaper on a piece of wood. By gauging how different levels of roughness affect sanding speed, they learn which tools are best for each job. Similarly, Nikuradse's experiments help us understand how pipe surface roughness impacts fluid flow.
Moody Chart and Its Usage
Chapter 9 of 9
🔒 Unlock Audio Chapter
Sign up and enroll to access the full audio experience
Chapter Content
Now let us tell you that how you use this Moody’s charts for real applications. For a real applications, first you compute for a particular discharge and the mu and the rho you can compute what will be the Reynolds numbers. And you know the type of the pipe what you were using and the diameters.
Detailed Explanation
The Moody chart is a vital tool for engineers that provides a way to determine friction factors based on Reynolds numbers and relative roughness. To use it, one must first calculate the Reynolds number based on the specific characteristics of the fluid and pipeline. This chart allows for quick reference to find the friction factors needed for calculations.
Examples & Analogies
Using a recipe can be likened to the Moody chart. Just as a recipe provides the right steps based on ingredients to achieve a meal (like calculating pressure losses), the Moody chart guides engineers to accurately calculate friction factors based on the flow conditions.
Key Concepts
-
Energy Loss: The energy that dissipates due to friction in fluid flow through pipes.
-
Friction Factor: A value reflecting the resistance to flow specific to a given surface roughness and flow conditions.
-
Reynolds Number: A dimensionless ratio that helps predict flow behavior in a pipe.
-
Moody Chart: A graphical representation of friction factors used in pipe flow calculations.
Examples & Applications
In a water supply system, calculating the head loss when water flows through a long, rough pipe helps engineers determine pump requirements.
Using the Moody chart, engineers can quickly find the friction factor for a given Reynolds number and type of pipe material.
Memory Aids
Interactive tools to help you remember key concepts
Rhymes
In pipes where water flows like a stream, head loss is often someone's dream, friction's a foe that makes energy scream.
Stories
Imagine water navigating a winding mountain path. Each bump on the road (pipe roughness) slows down the water, embodying the struggles of head loss.
Memory Tools
DRLF: Diameter, Roughness, Length, Flow - key factors affecting head loss in pipes.
Acronyms
HF for Head Loss Formula - reminds you that the Darcy-Weisbach is used to calculate energy loss.
Flash Cards
Glossary
- Head Loss
The reduction in total head (energy) of a fluid as it moves through a pipe due to frictional forces.
- Friction Factor (f)
A dimensionless number representing the resistance to flow due to the roughness of the pipe surface and flow conditions.
- Reynolds Number
A dimensionless value that indicates whether flow is laminar or turbulent, calculated based on velocity, viscosity, and characteristic length.
- DarcyWeisbach Formula
An equation used to calculate head loss due to friction in a pipe, given as: $$h_f = f \frac{L}{D} \frac{\rho v^2}{2g}$$.
Reference links
Supplementary resources to enhance your learning experience.