
Nikuradse’s Experimental Findings
Enroll to start learning
You’ve not yet enrolled in this course. Please enroll for free to listen to audio lessons, classroom podcasts and take practice test.
Interactive Audio Lesson
Listen to a student-teacher conversation explaining the topic in a relatable way.
Introduction to Pipe Flow Systems
🔒 Unlock Audio Lesson
Sign up and enroll to listen to this audio lesson

Welcome everyone! Today, we'll start with the fundamentals of pipe flow systems. Can anyone explain why understanding energy losses in pipes is important?

It's important because it helps in designing efficient water supply systems.

Yeah, if we know the losses, we can ensure enough pressure reaches different locations.
Exactly! These energy losses can be quantified, and one key concept we will discuss is head loss. Can anyone tell me how this relates to Bernoulli's equation?

Isn't head loss related to the pressure drop along the flow?
Right! Head loss tells us how much energy is lost due to friction and other factors. Remember, energy conservation is key here!
So, let's summarize: understanding head loss helps maintain pressure and flow in systems, which is critical for efficient design.
Dimensional Analysis in Pipe Flow
🔒 Unlock Audio Lesson
Sign up and enroll to listen to this audio lesson

Now, let’s look at dimensional analysis. Who can remind us what factors affect pressure drop in turbulent flow?

Things like pipe diameter, length, viscosity, and also average velocity change it.
Correct! We also need to consider the pipe's roughness. Why do you think that affects flow?
Rougher surfaces create more friction, leading to higher energy losses.
Exactly, and this detail will help us understand the turbulent flow better.
So, the main takeaway is that dimensional analysis helps explore how various factors affect pressure drop in pipes, especially in turbulent flow scenarios.
Nikuradse's Experimental Analysis
🔒 Unlock Audio Lesson
Sign up and enroll to listen to this audio lesson
Next, we will discuss Nikuradse’s experiments. Who can summarize the key finding about flow in laminar conditions?
He found that the friction factor is inversely proportional to the Reynolds number with a constant of 64.
That’s absolutely right! And how does roughness affect friction factors in turbulent flow?
Higher roughness increases the friction factors, meaning more energy is lost.
Great! And how do we practically apply this information using charts?
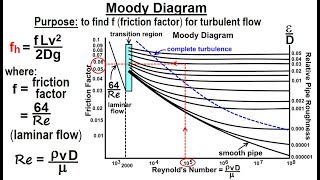
We can use the Moody chart to find friction factors for different types of pipes based on their roughness and flow conditions.
Exactly! The main point is that understanding these factors allows for better designs in real-world scenarios. Remember, this nexus of experimental data plays an important role.
Application of Darcy-Weisbach Equation
🔒 Unlock Audio Lesson
Sign up and enroll to listen to this audio lesson
Finally, let's connect everything with the Darcy-Weisbach equation. Who can write this equation for me?
It’s h = f * (L/D) * (v^2/2g).
Perfect! How do we use it to determine head loss?
We need the friction factor, length of the pipe, diameter, and velocity!
Exactly! It’s a systematic approach. And remember, each component must be measured accurately to ensure proper calculations of head loss effectively.
As a recap, today we learned how pipe conditions affect head loss and how Nikuradse’s findings can be utilized in practical applications.
Introduction & Overview
Read summaries of the section's main ideas at different levels of detail.
Quick Overview
Standard
This section delves into Nikuradse's experiments that quantified energy losses in pipe flow systems, emphasizing the impact of factors such as pipe roughness and Reynolds numbers. The findings detail the behavior of turbulent flow and introduce the Darcy-Weisbach equation for calculating head loss, correlating it with friction factors through empirical data.
Detailed
Nikuradse’s Experimental Findings
Nikuradse’s experiments addressed the quantification of energy losses in pipe flow systems, crucial for understanding hydraulic systems akin to water supply networks. His approach involved analyzing head losses determined by factors like the type and roughness of pipes and the average velocity of flow.
He conducted a dimensional analysis to understand the pressure drop in turbulent flow, linking it to the diameter, length, viscosity, velocity, and roughness of pipes. Much like fluid transmission in electrical systems, the concepts apply universally.
Nikuradse found that the friction factor in laminar flow is inversely proportional to the Reynolds number, with a constant of 64. He also studied artificial roughened pipes, revealing that friction factors are affected by increased pipe roughness, illustrating how energy losses correlate with both roughness and Reynolds numbers. Using the Moody chart, students can determine friction factors and energy losses based on these variables. Overall, Nikuradse’s findings provide essential data for engineers and researchers in understanding flow behavior in various piping systems.
Youtube Videos


Audio Book
Dive deep into the subject with an immersive audiobook experience.
Pipe Network Design
Chapter 1 of 5
🔒 Unlock Audio Chapter
Sign up and enroll to access the full audio experience
Chapter Content
So what they did is that to design pipe systems like, for example, we have a water supply system. There could be a source and there could be the pipe network to different locations. You can imagine it can have very complex pipe networks supplying water to different locations. How to design these pipe networks?
Detailed Explanation
The process of designing effective pipe networks involves understanding the flow of water from a source through a system of pipes to various distribution points. This requires knowledge of how the pipes are interconnected and how water flows through them. Designers need to account for various factors such as pipe diameter, length, and network complexity to ensure sufficient water supply and minimize energy loss.
Examples & Analogies
Imagine a city's water supply system as a series of roads leading from a reservoir (the source) to homes (distribution points). Just as traffic flow can be hindered by narrow roads or intersections, water flow in pipes can be affected by their diameter and length. Effective city planning aims to create wide, direct roads to ease traffic, akin to designing pipes that allow for efficient water flow.
Energy Loss in Pipe Flow
Chapter 2 of 5
🔒 Unlock Audio Chapter
Sign up and enroll to access the full audio experience
Chapter Content
We can find out how much energy losses or head losses occur in the pipe flow systems. You can quantify energy availability at different parts, which will allow us to understand whether the water flow is sufficient.
Detailed Explanation
In any pipe system, some energy is lost due to friction and turbulence as water flows. These energy losses are quantified as 'head losses.' By measuring these losses at various points in the network, engineers can assess the efficiency of the system and determine if the pressure is adequate for effective water delivery.
Examples & Analogies
Consider a long garden hose. If you try to water your garden with a narrow hose, the water pressure at the end may be low, resulting in weak flow. This pressure drop represents energy loss. Recognizing these losses helps gardeners (or engineers) adjust their setups to ensure strong water flow.
Dimensional Analysis and Governing Variables
Chapter 3 of 5
🔒 Unlock Audio Chapter
Sign up and enroll to access the full audio experience
Chapter Content
Now let us look at the dimensional analysis. A pressure drop along a pipe in turbulent flow depends on several quantities: pipe diameter, length, viscosity, average velocity, and average variations in pipe radius.
Detailed Explanation
Dimensional analysis helps us understand how different factors affect pressure drops in pipes under turbulent flow conditions. Key elements defined include pipe dimensions, flow speed, and viscosity. By examining these variables, one can uncover how they interact to influence the efficiency of fluid flow.
Examples & Analogies
Think about a river flowing through a valley. If the river bed is wide and smooth, water flows easily (akin to a wide pipe). However, if the river narrows or is filled with rocks (similar to increased roughness), the flow becomes turbulent and slows down, demonstrating the importance of pipe diameter and shape.
Effects of Pipe Roughness
Chapter 4 of 5
🔒 Unlock Audio Chapter
Sign up and enroll to access the full audio experience
Chapter Content
If you have a roughness in the pipes, then more problems regarding energy dissipation occur. Smooth pipes will have less energy dissipation, leading to less turbulence.
Detailed Explanation
The surface texture of a pipe significantly impacts how fluids flow through it. Rough surfaces create more friction, causing turbulence and increasing energy losses. Conversely, smooth surfaces reduce friction, leading to more efficient flow and less energy waste.
Examples & Analogies
Picture how water flows over a smooth stone in a stream versus a rough, jagged rock. The water flows quickly and smoothly over the smooth stone, while it splashes and slows down over the rough rock. This illustrates how pipe roughness influences flow efficiency.
Nikuradse's Experimental Findings and Friction Factor
Chapter 5 of 5
🔒 Unlock Audio Chapter
Sign up and enroll to access the full audio experience
Chapter Content
Nikuradse found that friction factors vary with Reynolds numbers and the roughness-to-diameter ratio, indicating how flow characteristics change in different conditions.
Detailed Explanation
Nikuradse's experiments established a relationship between flow conditions and energy losses in pipes. By plotting friction factors against Reynolds numbers, he illustrated how these variables interact. This data is essential in predicting how effective a pipe system will be in practice, aiding engineers in choosing appropriate materials for their designs.
Examples & Analogies
Think of a water slide at an amusement park. The slide's surface determines how fast a person can go down. A smooth slide (low friction factor) allows for a thrilling, fast ride, while a bumpy slide (high friction factor) slows the rider down. Just like that, pipes need to be chosen based on how they will handle the flow efficiently.
Key Concepts
-
Energy Losses: The reduction in energy available in a fluid due to friction and turbulence.
-
Dimensional Analysis: A mathematical approach used to understand how different physical quantities relate to each other.
-
Experimental Data: Information derived from practical experiments that validate theoretical principles.
-
Friction Factor Dependence: The relationship between friction factors and both Reynolds numbers and pipe roughness.
-
Application of Theories: Practical use of theoretical findings in designing and analyzing engineering systems.
Examples & Applications
Example of calculating head loss in a pipe version 1: Given a pipe with a diameter of 0.1 m, length of 50 m, and a velocity of 2 m/s, use the Darcy-Weisbach equation to find head loss.
Example of using the Moody chart: If a student has a Reynolds number of 2000 and relative roughness of 0.02, they can locate the corresponding friction factor on the Moody chart for calculation.
Memory Aids
Interactive tools to help you remember key concepts
Rhymes
Friction's a factor, losses we measure, in pipes flow smoothly, that's the treasure.
Stories
Imagine flowing water through a pipe; a smooth glass pipe has minimal resistances, while a rough concrete pipe struggles against the flow, losing energy—a lesson in pipe designs!
Memory Tools
REaL PiPe - Reynolds, Energy loss, Laminar flow, Pipe, and pressure - all relate to fluid dynamics.
Acronyms
F-L-O-W - Friction, Losses, Obstructions, and Water - keys to understanding pipe flow.
Flash Cards
Glossary
- Head Loss
The loss of energy in a flowing fluid due to friction and other resistance within a pipe.
- Reynolds Number
A dimensionless quantity that helps predict flow patterns in different fluid flow situations.
- Friction Factor
A dimensionless number representing the frictional resistance in a pipe due to its roughness and the flow conditions.
- DarcyWeisbach Equation
An equation used to calculate head loss in a pipe flow based on friction factors, pipe length, and diameter.
- Moody Chart
A graphical representation used to estimate the friction factor for flow in pipes based on the Reynolds number and relative roughness.
Reference links
Supplementary resources to enhance your learning experience.