
Pipe Roughness and Behavior
Enroll to start learning
You’ve not yet enrolled in this course. Please enroll for free to listen to audio lessons, classroom podcasts and take practice test.
Interactive Audio Lesson
Listen to a student-teacher conversation explaining the topic in a relatable way.
Introduction to Pipe Systems and Energy Losses
🔒 Unlock Audio Lesson
Sign up and enroll to listen to this audio lesson

Today we're starting our exploration of pipe systems, focusing on the energy losses that occur due to the roughness of pipes. Can anyone tell me what factors might affect the flow in a pipe?

I think the diameter and length of the pipe might have an effect.
Good observation! In addition to those, roughness is crucial. A rougher surface means more friction, leading to increased energy losses. This can be summed up using the acronym 'R.E.L.'—Roughness, Energy, Losses.

So, does that mean smoother pipes are better for saving energy?
Exactly! Smoother pipes reduce turbulence and energy dissipation. Does anyone know why we measure energy loss in terms of head loss?

Isn’t head loss related to Bernoulli's principle?
Yes! Head loss represents the energy loss due to friction and can be analyzed through Bernoulli's equation. Let's recap—Roughness increases energy loss, so smoother pipes save energy!
Dimensional Analysis and Flow Behavior
🔒 Unlock Audio Lesson
Sign up and enroll to listen to this audio lesson

Next, let's talk about dimensional analysis. How do you think factors like viscosity and average velocity factor into flow behavior?

They probably help calculate how fluid moves, right?
Correct! They help quantify the relationship between different parameters affecting flow. A key term to remember is the Reynolds number—it helps us characterize flow regimes.
So, we can see whether the flow is laminar or turbulent?
Exactly! Turbulent flow leads to more energy loss due to increased friction. To emphasize this, remember the acronym 'F.L.O.W.'—Friction, Losses, and Overall impact on energy.
Understanding Friction Factors and Moody Chart
🔒 Unlock Audio Lesson
Sign up and enroll to listen to this audio lesson
Now, let's focus on friction factors. Who can explain what a friction factor is?
Is it about how the surface of the pipe affects the flow?
Yes! It represents the resistance to flow due to surface roughness. Applying this, we can evaluate flow characteristics using the Moody chart. Can anyone summarize how to use the Moody chart?
You find your Reynolds number and then check the curve for the corresponding roughness to determine the friction factor.
Perfect! Always remember that a high roughness results in higher friction factors and therefore higher energy losses. Let's recap—friction factors indicate energy loss, and the Moody chart helps us interpret these losses.
Introduction & Overview
Read summaries of the section's main ideas at different levels of detail.
Quick Overview
Standard
The section explores how pipeline roughness affects energy and head losses during fluid flow, drawing parallels with electrical power transmission. It also examines significant concepts like dimensional analysis, flow regimes, and the importance of geometric and surface roughness in fluid dynamics.
Detailed
In this section, the focus is on pipe systems, particularly in water supply networks, where understanding the impact of roughness on fluid behavior is crucial. The discussion begins by addressing how energy losses—both head and kinetic—affect fluid dynamics in turbulent flow conditions. Key principles such as Bernoulli’s equation, the role of mean average conditions, and dimensional analysis are examined, highlighting how parameters like pipe diameter, length, viscosity, and roughness height influence pressure drops and energy loss. Additionally, the significance of roughness is underscored, showing that smoother pipes induce less energy loss compared to rough pipes. The section culminates in an exploration of the Moody chart, which represents experimental findings on friction factors relating to Reynolds numbers and roughness, underlining its practical applications in engineering design.
Youtube Videos


Audio Book
Dive deep into the subject with an immersive audiobook experience.
Understanding Pipe Networks
Chapter 1 of 5
🔒 Unlock Audio Chapter
Sign up and enroll to access the full audio experience
Chapter Content
To design pipe systems like water supply systems, we consider various factors including energy losses and head losses in the pipe flow systems. This helps us quantify energy availability at different parts of the network.
Detailed Explanation
In designing systems like water supply networks, engineers must account for how energy is lost as water flows through pipes. This involves calculating 'head losses', which indicate how much energy is consumed in the process. By understanding where energy losses occur, we can ensure that water reaches its destination efficiently, allowing for proper flow and pressure.
Examples & Analogies
Think of it like a bank of battery power used to run a device. If the device works well, the battery lasts longer, and its power is distributed effectively. However, if there are leaks or faulty connections, power is wasted, just like energy is lost in a pipe system if we don’t account for head losses.
Dimensional Analysis and Influencing Factors
Chapter 2 of 5
🔒 Unlock Audio Chapter
Sign up and enroll to access the full audio experience
Chapter Content
Pressure drop in turbulent flow along a pipe depends on several factors like pipe diameter, length, viscosity, average velocity, and variations in pipe radius due to roughness.
Detailed Explanation
When analyzing turbulent flow in pipes, various physical parameters affect the pressure loss. These include the dimensions of the pipe (diameter and length), fluid characteristics (like viscosity), and the flow conditions (such as average velocity). The 'roughness' of the pipe's interior surface also plays a crucial role, as it can create more turbulence and thus more energy loss during flow.
Examples & Analogies
Imagine water flowing through a small, thin straw versus a wide, smooth pipe. The small straw, like a rough pipe, creates more resistance and pressure loss, making it harder to drink through. In contrast, a wider, smooth pipe allows for easier flow, similar to how well-designed pipes behave.
Impact of Pipe Roughness
Chapter 3 of 5
🔒 Unlock Audio Chapter
Sign up and enroll to access the full audio experience
Chapter Content
Pipes have varying levels of roughness that affect flow characteristics. Smooth pipes incur less energy loss and turbulence, while rough pipes lead to increased energy dissipation.
Detailed Explanation
Even though a pipe may look smooth externally, on a microscopic level, surfaces can be quite rough. This roughness disrupts the flow of fluid, causing turbulence and increasing energy loss. Therefore, the rougher the pipe, the more energy is lost as the fluid flows through, highlighting the importance of material selection in pipe design.
Examples & Analogies
Consider a calm lake vs. a rocky river. The calm lake lets boats glide smoothly, wasting little energy, while the rocky river causes boats to bounce and slow down. Similarly, smooth pipes allow for efficient water movement, while rough pipes create obstacles that waste energy.
Dimensional Analysis and Friction Factors
Chapter 4 of 5
🔒 Unlock Audio Chapter
Sign up and enroll to access the full audio experience
Chapter Content
Dimensional analysis helps in understanding how pressure drop relates to variables like pipe geometry and fluid characteristics. Friction factors, determined through experiments, depend on Reynolds numbers and the ratio of roughness to diameter.
Detailed Explanation
Dimensional analysis provides insights into the relationships between different physical parameters affecting fluid flow. By measuring the friction factor, engineers can categorize flow types and predict how materials will behave under different conditions. This analysis leads to developing formulas that account for energy loss, which is critical for designing efficient systems.
Examples & Analogies
Think of the frictional resistance when you slide a book across a table. Each surface offers different resistance, just as various pipe materials possess unique friction factors. Understanding these interactions helps engineers design better systems, much like choosing the right table material can facilitate smoother sliding of books.
Characterizing Flow with Moody's Chart
Chapter 5 of 5
🔒 Unlock Audio Chapter
Sign up and enroll to access the full audio experience
Chapter Content
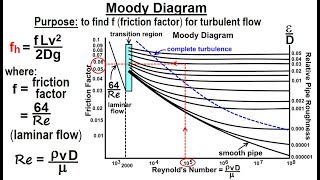
Moody's chart compiles experimental data showing the relationship between Reynolds numbers and friction factors for both commercial and artificially roughened pipes.
Detailed Explanation
Moody's chart provides a visual representation of how friction factors vary with Reynolds numbers and relative roughness. By using this chart, engineers can quickly estimate energy losses in different pipe systems based on their specific characteristics, facilitating better system designs for varied applications.
Examples & Analogies
Imagine Moody's chart as a guidebook for a restaurant menu. Just like you refer to it to find out which dish to order based on your taste and preference (thickness or spiciness), engineers use Moody's chart to determine the best pipe materials and behaviors based on flow types and conditions.
Key Concepts
-
Pipe Roughness: Refers to the internal surface texture of pipes, affecting fluid flow.
-
Head Loss: Indicates the energy loss from fluid friction in pipes; crucial for designing efficient systems.
-
Reynolds Number: A key dimensionless value that helps characterize flow regimes as laminar or turbulent.
-
Friction Factors: Quantitatively describe the resistance to flow based on surface roughness, determined using the Moody chart.
Examples & Applications
A water supply system's design accounts for energy losses due to roughness, ensuring efficient flow to various locations.
Smooth pipes decrease turbulence, resulting in lower energy losses compared to rough pipes, demonstrated by real-world applications in plumbing.
Memory Aids
Interactive tools to help you remember key concepts
Rhymes
In pipes that are smooth, the flow is a breeze; but roughness brings loss, so please take heed.
Stories
Imagine a river on a smooth stone bed, flowing swiftly with ease. Then picture the same river running over jagged rocks, losing its energy—this represents how pipe roughness influences flow.
Memory Tools
To remember the impacts of pipe roughness, think 'R.E.L.'—Roughness increases Energy Loss.
Acronyms
F.L.O.W. helps remember that Friction leads to Losses in Overall energy.
Flash Cards
Glossary
- Pipe Roughness
The texture of the internal surface of a pipe, impacting flow resistance and energy loss.
- Head Loss
The loss of energy due to friction in a pipe, often measured in terms of height (head).
- Reynolds Number
A dimensionless number used to predict flow patterns in different fluid flow situations.
- Moody Chart
A graphical representation of the relationship between friction factor, Reynolds number, and relative roughness.
Reference links
Supplementary resources to enhance your learning experience.