
Use of Moody Chart for Calculating Friction Factors
Enroll to start learning
You’ve not yet enrolled in this course. Please enroll for free to listen to audio lessons, classroom podcasts and take practice test.
Interactive Audio Lesson
Listen to a student-teacher conversation explaining the topic in a relatable way.
Introduction to Flow Systems
🔒 Unlock Audio Lesson
Sign up and enroll to listen to this audio lesson

Today, we're diving into how we can use the Moody Chart for calculating friction factors in pipe systems. Why is it important to consider energy losses in these systems?

To ensure that we have enough energy to supply water to all locations, right?
Exactly! Energy losses can greatly affect flow efficiency. Can anyone explain what factors might contribute to these losses?

I think things like pipe diameter and roughness matter because they can affect how smoothly the water flows.

And the length of the pipe as well! The longer it is, the more losses you have.
Great observations! These factors are crucial for determining the overall efficacy of a water supply system.
Understanding the Moody Chart
🔒 Unlock Audio Lesson
Sign up and enroll to listen to this audio lesson

Now let's talk about the Moody Chart itself. Can anyone describe what they think it represents?
Isn't it a graph that shows how friction factors vary with Reynolds numbers?
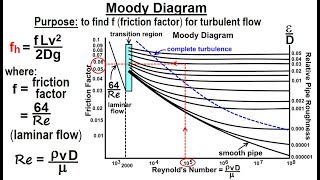
Yes, and it also includes relative roughness! Remember, the Moody Chart provides a visual representation to interpolate friction factors effectively.

So, if we know our Reynolds number and the type of pipe we're using, we can find the friction factor from the chart?
Exactly, and that's how we can calculate energy losses in practical applications seamlessly.
Friction Factors in River and Transition Flow
🔒 Unlock Audio Lesson
Sign up and enroll to listen to this audio lesson
Let's look at different flow types. Can anyone explain how laminar flow behaves concerning friction factors?
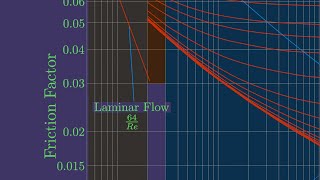
In laminar flow, the friction factor is inversely proportional to the Reynolds number.
Right! And what about turbulent flow with varying roughness?
As the roughness increases, the friction factor increases as well!
And we also have to consider transitional flow where the behavior shifts from smooth to rough effects?
Good point! Understanding these transitions is essential for accurate forecasts in energy losses.
Application of the Moody Chart
🔒 Unlock Audio Lesson
Sign up and enroll to listen to this audio lesson
Now that we understand the chart, how do we apply it in real-world situations?
First, calculate the Reynolds number based on discharge, right?
Exactly! Then we look at the relative roughness of the pipe and use the Moody Chart to find the friction factor.
Can we directly see how much energy we lose by knowing the friction factor?
Yes! It directly helps us compute energy losses using the Darcy-Weisbach equation, which ties back to our earlier discussion.
Introduction & Overview
Read summaries of the section's main ideas at different levels of detail.
Quick Overview
Standard
The use of the Moody Chart for calculating friction factors in pipe systems is explained therein. It emphasizes the comparison between laminar and turbulent flows, how roughness impacts energy losses, and the integral role of the Moody Chart as a tool for determining friction factors based on flow conditions.
Detailed
Detailed Summary
In this section, we explore the crucial role of the Moody Chart in evaluating friction factors within various pipe systems, particularly concerning water supply networks. The discussion begins with the necessity of determining energy and head losses throughout complex pipe networks. By employing Bernoulli's equation and various flow conditions, it highlights the significance of dimensional analysis in understanding pressure drops in turbulent flow.
Key variables include pipe diameter, length, viscosity, and average velocity, as they collectively contribute to analyzing friction and energy dissipation through rough and smooth pipes. The Moody Chart is revealed as an essential reference for engineers, enabling them to interpolate friction factors based on calculated Reynolds numbers and the pipes' relative roughness.
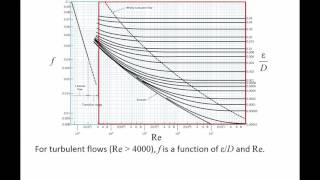
The section draws upon empirical data from experiments conducted by Nikuradse, illustrating the unique characteristics of laminar, transitional, and turbulent flows. The classification of flows reveals that friction factors are inverse in laminar flow but showcase a complex relationship in turbulent flow, dominated by pipe roughness. Ultimately, the Moody Chart serves to illustrate how friction factors fluctuate with varying Reynolds numbers, thus allowing for precise calculations of friction losses in real-world applications.
Youtube Videos
![Turbulent Flow: Moody Chart [Fluid Mechanics #41]](https://img.youtube.com/vi/tISdp_394Bw/mqdefault.jpg)


Audio Book
Dive deep into the subject with an immersive audiobook experience.
Introduction to Pipe Systems and Energy Loss
Chapter 1 of 4
🔒 Unlock Audio Chapter
Sign up and enroll to access the full audio experience
Chapter Content
So what they did it that to design this pipe systems like for examples, we have a water supply systems, okay. So if you have a water supply systems, there could be a source and there could be the pipe network to different locations. There will be you can imagine it that can have a very complex pipe networks supplying to water to different locations. How to design these pipe networks.
So now it is coming it that we can find out how much energy losses, how the head losses in the pipe flow systems. You can know the how much of energy loss is here, how much of energy loss is here, how much of energy loss is here, then I can quantify it the energy availability at different parts.
Detailed Explanation
This chunk introduces the concept of pipe systems used in water supply. In such systems, numerous pipes transport water from a central source to various destinations. When designing these systems, it's crucial to understand energy losses, particularly head losses, which refer to the decrease in energy due to factors like friction as water moves through the pipes. Identifying and quantifying these losses can ensure that there is adequate energy available in the system at different points, which is vital for maintaining flow.
Examples & Analogies
Think of a garden hose. If you squeeze the hose or if the hose has bends or kinks, the water flow decreases, which represents energy loss. Similar to how a garden hose needs to be unobstructed for effective water delivery, a well-designed pipe system must minimize energy losses to ensure adequate water reaches its destination.
Dimensional Analysis of Head Loss
Chapter 2 of 4
🔒 Unlock Audio Chapter
Sign up and enroll to access the full audio experience
Chapter Content
Now let us now what we are doing it first the dimensional analysis. So if there is a pressure drop along a pipe in a turbulent flow depends upon the following quantities. Pipe diameters, length of the pipe okay diameters, the length of the pipe, coefficient of viscosity, average velocity and small e represents the average variations in pipe radius.
Detailed Explanation
This chunk discusses dimensional analysis, focusing on the factors influencing head loss in a pipe under turbulent flow conditions. The pressure drop is influenced by the diameter and length of the pipe, the fluid's viscosity, average flow velocity, and subtle variations in the pipe's radius due to roughness. By analyzing these factors, engineers can predict how various conditions will affect fluid flow and energy losses.
Examples & Analogies
Imagine driving a car on a highway versus a bumpy dirt road. The smooth highway represents a low-friction environment with less resistance, analogous to a pipe with a larger diameter and smooth surface. However, on the uneven dirt road, the bumps increase resistance, similar to how rough pipe surfaces increase energy losses in turbulent flow.
Effects of Pipe Roughness on Energy Loss
Chapter 3 of 4
🔒 Unlock Audio Chapter
Sign up and enroll to access the full audio experience
Chapter Content
So there is a variations of the pipe radius. The pipe radius but it could be a sub-millimeter levels, what we are talking about. We are not talking about the centimeters which you can see, some millimeter level one 10th of the millimeter level, that type of roughness what we are looking it and that what we are getting it. And if we are getting it how these things are affecting this the turbulence behaviors and the energy dissipations.
Detailed Explanation
This chunk emphasizes the importance of understanding pipe roughness, even at a microscopic level. Roughness affects how fluid flows through the pipe; smoother pipes generally exhibit lower energy losses, while rougher pipes increase turbulence and energy dissipation. Knowing the roughness allows engineers to better predict how fluids behave in different pipe types, impacting system efficiency.
Examples & Analogies
Think about a smooth ceramic mug versus a rough concrete one. When you pour liquid into the ceramic mug, it flows smoothly. However, pouring into the rough concrete surface would create more splashes and irregular flow patterns, similar to how rough pipes cause greater turbulence and energy losses in fluid transport.
Using Moody Chart for Friction Factors
Chapter 4 of 4
🔒 Unlock Audio Chapter
Sign up and enroll to access the full audio experience
Chapter Content
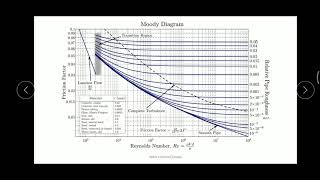
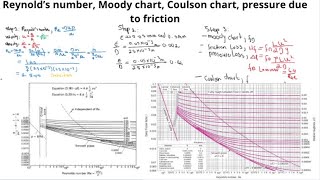
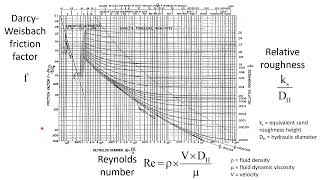
Now let us tell you that how you use this Moody’s charts for real applications. For a real applications, first you compute for a particular discharge and the mu and the rho you can compute what will be the Reynolds numbers. And you know the type of the pipe what you were using and the diameters. So you know these two values. As I have these two value what I will do it ... if I know Reynolds numbers and the relative roughness value.
Detailed Explanation
This chunk explains how to apply the Moody Chart in practical scenarios. To use the chart, you first need to calculate the Reynolds number based on the fluid's discharge, viscosity, and density. Once obtained, using the type of pipe and its diameter, you can find the corresponding friction factor using the chart. The friction factor is critical for calculating energy losses due to friction in the system. By understanding your pipe's relative roughness and Reynolds number, you can efficiently determine how much energy will be expended during fluid flow.
Examples & Analogies
Consider a car's fuel efficiency: you need to know the car type and driving conditions to estimate how much fuel it will need. Similarly, when using the Moody Chart, you need specific information about the fluid flow and pipe characteristics to accurately assess how much energy will be lost navigating through your system.
Key Concepts
-
Friction Factor: A coefficient that represents the resistance to flow due to friction in a pipe.
-
Reynolds Number: A dimensionless number indicating flow type; low values signify laminar flow, while high values indicate turbulent flow.
-
Moody Chart: A tool for estimating friction factors based on Reynolds number and relative roughness.
Examples & Applications
An engineer calculating the friction factor for a water supply system using the Moody Chart based on specific Reynolds numbers.
A comparison of energy losses between a smooth and a rough pipe using the Darcy-Weisbach equation.
Memory Aids
Interactive tools to help you remember key concepts
Rhymes
Use Moody's chart to understand flow, friction and losses will help you know!
Stories
Imagine a river flowing through a smooth pipe, losing little energy, while a rough one struggles, keeping the swim tight.
Memory Tools
FRH for remembering friction, roughness, and head loss – all affect flow!
Acronyms
RFL for Remembering Flow Loss
for Reynolds number
for Friction
for Losses!
Flash Cards
Glossary
- Moody Chart
A graphical representation used to determine friction factors based on flow type, Reynolds number, and relative roughness.
- Friction Factor
A dimensionless number used in fluid mechanics to describe the frictional losses in a fluid flow.
- Reynolds Number
A dimensionless quantity that describes the flow regime of a fluid, indicative of whether the flow is laminar or turbulent.
- Head Loss
The energy lost due to friction in pipes, calculated as the height of fluid that would provide such energy loss.
- DarcyWeisbach Equation
An equation used to calculate head loss in a pipe due to friction; it relates the friction factor with flow velocity and pipe diameter.
Reference links
Supplementary resources to enhance your learning experience.