
Moody Chart and Its Application
Enroll to start learning
You’ve not yet enrolled in this course. Please enroll for free to listen to audio lessons, classroom podcasts and take practice test.
Interactive Audio Lesson
Listen to a student-teacher conversation explaining the topic in a relatable way.
Introduction to Energy Loss in Pipe Flow
🔒 Unlock Audio Lesson
Sign up and enroll to listen to this audio lesson

Today, we'll discuss the concept of energy loss in pipe flow. Can anyone tell me what energy loss refers to?

Isn't it when the fluid loses pressure or speed as it moves through the pipe?
Exactly! Energy loss occurs due to friction and turbulence as fluid flows through pipes. Remember the acronym 'FTE' for Friction, Turbulence, and Energy. Who can give an example of energy loss?

I think in water supply systems, the way water moves through different diameters can cause energy loss.
That's a great example! The pipe diameter indeed impacts energy loss. Let's delve deeper into these losses using the Moody chart.
Understanding the Moody Chart
🔒 Unlock Audio Lesson
Sign up and enroll to listen to this audio lesson

The Moody chart helps us visualize how friction factors vary with Reynolds numbers and pipe roughness. Who can explain why this is important?

I think it helps us estimate how much energy is lost in different flow scenarios?
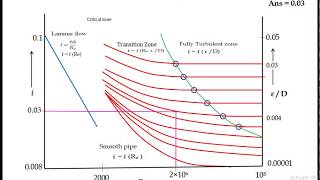
Correct! By knowing the Reynolds number and relative roughness, we can interpolate the friction factor from the chart. Let's practice that with an example. If we have a relative roughness of 0.02 and a Reynolds number of 10,000, how would we find the friction factor?

We would locate 10,000 on the chart and find where it intersects the 0.02 line to get the friction factor.
Precisely! This visual tool simplifies complex calculations, making our designs more efficient.
Dimensional Analysis and Flow Characteristics
🔒 Unlock Audio Lesson
Sign up and enroll to listen to this audio lesson
Let’s discuss the parameters that influence head loss in pipes. Can anyone name a few?
Pipe diameter, flow velocity, and viscosity, right?
Well done! Also, don’t forget roughness! The acronym 'DVR' can help you recall Diameter, Velocity, and Roughness. How do these parameters affect head loss, specifically in turbulent flow?
I think a larger diameter would reduce losses, while increased roughness would increase losses.
Exactly! Larger diameters reduce turbulence, while roughness increases it. It's crucial to consider these when designing effective systems.
Friction Factors and Energy Dissipation
🔒 Unlock Audio Lesson
Sign up and enroll to listen to this audio lesson
Now, let's talk about friction factors, crucial for calculating head loss. Who knows how these factors are determined?
I remember it’s from experimental data and how they vary with Reynolds numbers and roughness.
Correct again! The friction factor can be determined experimentally, showing a relationship with Reynolds numbers and relative roughness. Can anyone summarize why understanding this is vital in engineering?
Knowing the friction factor helps us minimize energy loss in designs, making systems more efficient.
Bravo! Minimizing energy loss translates into cost savings and improved performance in real-world applications.
Review and Applications of the Moody Chart
🔒 Unlock Audio Lesson
Sign up and enroll to listen to this audio lesson
Let’s review what we’ve learned! Can someone define what the Moody chart represents?
It shows the relationship between Reynolds numbers and friction factors for different pipe roughness.
Excellent! How can we apply this information in real-world engineering scenarios?
By estimating friction factors for various pipes, we can predict energy losses and design more efficient systems.
Correct! Understanding these concepts ensures we design effective, cost-efficient fluid systems.
Introduction & Overview
Read summaries of the section's main ideas at different levels of detail.
Quick Overview
Standard
The section details how the Moody chart is utilized in the design of pipe networks, focusing on the quantification of energy loss due to head losses in various flow conditions, particularly turbulent flow. It highlights the importance of parameters such as Reynolds numbers and roughness in determining friction factors and energy loss.
Detailed
Moody Chart and Its Application
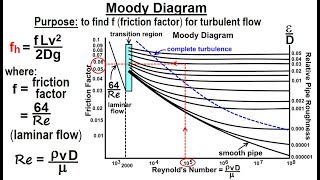
The Moody chart is an essential tool in fluid mechanics, particularly in evaluating energy losses and head losses in pipe flow systems. Understanding energy dissipation in turbulent flow is crucial for engineers designing water supply systems and other fluid networks. This section delves into the relationship between flow characteristics and friction losses, emphasizing the importance of concepts like Reynolds numbers and pipe roughness.
Energy loss in fluid systems can be quantitatively assessed using Bernoulli’s equation, particularly in turbulent flows where average pressure and velocity become key metrics. The section introduces concepts such as dimensional analysis, with an emphasis on how variables such as pipe diameter, length, viscosity, and roughness affect flow characteristics.
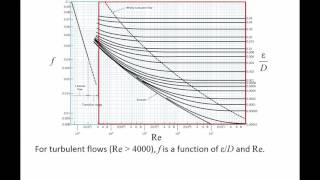
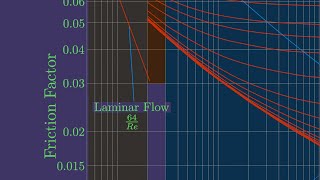
The importance of the friction factor is discussed, showing how it’s derived from conducting experimental analysis of different pipe flows, helping quantify how much energy is lost in the system. The significance of Nikuradse's experiments and their findings regarding laminar and turbulent flows is highlighted, leading to the creation of the Moody chart, which visually represents the relationship between Reynolds numbers and friction factors across different relative roughness values. This representation is crucial for practical applications, enabling engineers to quickly find friction factors and therefore approximate energy losses for specific pipe scenarios.
Youtube Videos

![Turbulent Flow: Moody Chart [Fluid Mechanics #41]](https://img.youtube.com/vi/tISdp_394Bw/mqdefault.jpg)


Audio Book
Dive deep into the subject with an immersive audiobook experience.
Introduction to Pipe Systems and Energy Losses
Chapter 1 of 6
🔒 Unlock Audio Chapter
Sign up and enroll to access the full audio experience
Chapter Content
To design pipe systems like water supply systems, we consider energy losses and head losses in the pipe flow systems. These energy losses occur at different parts of the pipe network, affecting energy availability and flow.
Detailed Explanation
When designing a water supply system, engineers need to account for how energy is lost due to friction and other factors. Flow in a pipe can get complicated due to various factors, and understanding where and how energy loss occurs helps to ensure efficient delivery of water to different locations. Energy availability at different sections of the pipe is crucial because it influences whether water can flow effectively.
Examples & Analogies
Imagine a water hose at home. If you were to kink or narrow the hose, you would notice that water drips out slower or not at all, which is similar to how energy loss impacts the flow in a pipe system. Properly designing pipes to minimize energy loss ensures that water flows more freely, just like using a straight, unrestricted hose.
Understanding Head Loss and Bernoulli’s Equation
Chapter 2 of 6
🔒 Unlock Audio Chapter
Sign up and enroll to access the full audio experience
Chapter Content
Head loss in pipe flow relates to how energy decreases along the flow path. We analyze this using Bernoulli’s equations and consider how turbulent flow affects energy loss.
Detailed Explanation
Head loss refers to the loss of energy as water flows through a pipe, which can be quantified using Bernoulli’s equation. When flow is turbulent, it leads to more energy loss because of mixing and movement within the fluid that increases friction between the fluid and pipe walls. This complexity necessitates experimental methods to determine how significant these losses are.
Examples & Analogies
Think of riding a bike down a smooth path versus a rocky terrain. On a smooth path, you roll quickly with minimal resistance (like laminar flow), but on rocky terrain, your pedaling requires much more effort due to the friction and obstacles (like turbulent flow). Just like the rocky path results in a loss of 'energy,' so too does turbulent water flow through pipes.
Factors Affecting Pressure Drop
Chapter 3 of 6
🔒 Unlock Audio Chapter
Sign up and enroll to access the full audio experience
Chapter Content
Pressure drop in turbulent flows depends on pipe diameter, length, viscosity, average velocity, and pipe roughness. Dimensional analysis helps to understand these relationships.
Detailed Explanation
The pressure drop, or loss of pressure in pipes as fluid flows, is influenced by several factors such as the diameter and length of the pipe, the viscosity of the fluid, and how rough the pipe's interior surface is. Dimensional analysis allows us to simplify these factors into more manageable, non-dimensional forms to predict how pressure drop changes under different conditions.
Examples & Analogies
Consider a large tube and a small straw. Water moves easily through the large tube (less resistance), but moving it through a small straw takes more force (more resistance). Likewise, longer pipes and rougher surfaces add to the effort required to push water through them.
Dimensional Analysis and Friction Factor
Chapter 4 of 6
🔒 Unlock Audio Chapter
Sign up and enroll to access the full audio experience
Chapter Content
Through dimensional analysis, we can express the pressure drop in terms of a friction factor that depends on Reynolds number and relative roughness.
Detailed Explanation
Dimensional analysis leads to the identification of a non-dimensional friction factor, which serves as a crucial parameter in determining head loss. This analysis allows engineers to understand how different flow conditions (defined by the Reynolds number) and pipe characteristics (defined by roughness) interact to affect fluid behavior within the pipe.
Examples & Analogies
Imagine fitting a water gun nozzle into different pipe materials—some will flow water smoothly (like glass) while others (like rough copper pipes) will impede flow due to rough edges. The friction factor tells us how much more energy we lose as we use less-than-ideal pipes, helping us avoid inefficient setups.
Nikuradse’s Experiments and Results
Chapter 5 of 6
🔒 Unlock Audio Chapter
Sign up and enroll to access the full audio experience
Chapter Content
Nikuradse conducted experiments using artificial roughened pipes to analyze how friction factors vary with Reynolds numbers, revealing key relationships in pipe flow.
Detailed Explanation
Nikuradse's experiments were pivotal for understanding how the surface roughness of pipes impacts friction factors. He manipulated rough surfaces to create varying degrees of turbulence and successfully demonstrated a pattern: friction factors reduce in laminar flow but increase for turbulent flow as roughness increases, which is crucial for predicting energy losses in real-world applications.
Examples & Analogies
Think of a river flowing smoothly over a pebble-free bottom versus a river littered with rocks and boulders. The rocky river causes more 'friction' against the flow of the water, much like how rough pipes create turbulence and increase energy losses, showing how important surface smoothness is in any potential water transportation setup.
Moody Chart Utility
Chapter 6 of 6
🔒 Unlock Audio Chapter
Sign up and enroll to access the full audio experience
Chapter Content
The Moody chart summarizes the relationship between Reynolds numbers and friction factors for various pipe materials, aiding engineers in practical applications.
Detailed Explanation
The Moody chart is a tool that engineers use to quickly determine the friction factor for a specific type of pipe and flow condition based on known Reynolds numbers and relative roughness. By finding their values on the chart, engineers can calculate expected head losses in pipes accurately, facilitating better design decisions.
Examples & Analogies
Using the Moody Chart is like checking a weather app before planning your day's outfit. Just as the app gives you important information about conditions, the chart provides essential details needed to avoid problems with energy losses in piping systems, enabling smoother and more efficient water flow.
Key Concepts
-
Moody Chart: A graphical tool used to find friction factors in pipe flows based on Reynolds numbers and relative roughness.
-
Head Loss: The energy loss occurring due to friction and turbulence as fluid flows through pipes.
-
Reynolds Number: A dimensionless number that indicates the type of flow (laminar or turbulent) in a fluid system.
-
Friction Factor: A critical coefficient that quantifies resistance to flow in pipes, dependent on various factors.
Examples & Applications
Example 1: In a water supply system, if the diameter of the pipe changes, the energy loss due to friction will differ, affecting overall efficiency.
Example 2: When comparing smooth and rough pipes of the same diameter, a rough pipe will experience higher energy losses due to increased turbulence.
Memory Aids
Interactive tools to help you remember key concepts
Rhymes
To calculate the flow with ease, check the chart before you squeeze.
Stories
Imagine a pipe where water flows, its speed decreasing where turbulence grows. Engineers must measure with care, to design systems that are efficient and fair.
Memory Tools
Remember 'FTE' for Friction, Turbulence, and Energy loss in pipes.
Acronyms
Use 'DVR' to recall Diameter, Velocity, and Roughness affecting flow.
Flash Cards
Glossary
- Moody Chart
A graphical representation that relates the friction factor, Reynolds number, and relative roughness for flow in pipes.
- Reynolds Number
A dimensionless quantity used to predict flow patterns in different fluid flow situations.
- Head Loss
The loss of energy due to friction as fluid flows through a pipe.
- Friction Factor
A dimensionless number used to describe the frictional resistance in a pipe flow.
- Dimensional Analysis
A mathematical technique for analyzing the relationships between different physical quantities by identifying their fundamental dimensions.
Reference links
Supplementary resources to enhance your learning experience.