
Energy Losses in Pipe Flow
Enroll to start learning
You’ve not yet enrolled in this course. Please enroll for free to listen to audio lessons, classroom podcasts and take practice test.
Interactive Audio Lesson
Listen to a student-teacher conversation explaining the topic in a relatable way.
Introduction to Head Loss in Pipe Flow
🔒 Unlock Audio Lesson
Sign up and enroll to listen to this audio lesson

Today, we are going to explore head losses in pipe flow. Can anyone tell me what happens to the energy of water as it flows through pipes?

Does it lose energy due to friction with the pipe walls?
Exactly! This loss of energy is what we call 'head loss'. So, why is it essential to quantify this loss in water supply systems?

It helps to ensure that enough pressure and flow are maintained at the delivery points.
Correct! Remember, the energy available at the outlets is determined by the head loss throughout the system.

How do we measure head loss?
Great question! We utilize Bernoulli’s equation and conduct experiments to quantify these losses based on pipe characteristics and flow conditions.
To summarize, head loss in pipe flow is critical for maintaining system efficiency, and we can calculate it using established equations.
Key Factors Affecting Energy Losses
🔒 Unlock Audio Lesson
Sign up and enroll to listen to this audio lesson

Now, let’s dive into the factors that influence energy losses. What do you think plays a significant role?

I think the diameter and length of the pipe are important.
Yes, absolutely! The diameter affects the flow velocity, while length contributes to the overall resistance. What else?
What about the surface roughness of the pipe?
Exactly! Surface roughness affects turbulence and friction losses. A smooth pipe will have less energy dissipation compared to a rough one.
How do we quantify roughness?
We measure it in terms of the ratio of roughness to diameter, denoted as e/D. The impact of this ratio is crucial in determining friction factors, which we’ll discuss next.
In summary, key factors include pipe diameter, length, and surface roughness, all crucial for understanding energy losses.
Understanding Friction Factors
🔒 Unlock Audio Lesson
Sign up and enroll to listen to this audio lesson
Let’s talk about friction factors and their relationship with Reynolds numbers. Who can explain what a Reynolds number is?
It measures the flow regime, whether it’s laminar or turbulent, right?
Exactly! And friction factors are dependent on both Reynolds numbers and relative roughness. Let's connect this to the Darcy-Weisbach equation. Can anyone express it?
The equation is h = f * (L/D) * (v^2/2g), where h is head loss.
Perfect! So, higher friction factors indicate greater energy losses. How do we determine these friction factors?
We can use experimental data, like from Nikuradse's experiments or Moody's chart.
Right! We base our friction factors on empirical data to optimize our pipe systems.
In summary, friction factors are determined using Reynolds numbers and roughness ratios, impacting our energy loss calculations in pipe flow.
Introduction & Overview
Read summaries of the section's main ideas at different levels of detail.
Quick Overview
Standard
The section provides a comprehensive overview of how energy losses manifest in pipe flow systems, explaining the concepts of head loss and friction factors. It outlines the relationship between pipe characteristics and energy dissipation, referencing various experimental studies to quantify these losses.
Detailed
Detailed Summary
This section delves into the critical topic of energy losses in pipe flow systems, particularly in the context of water supply networks. As water flows through various pipes, energy is dissipated due to friction and turbulence, resulting in head losses that must be understood and quantified for effective system design. The key points include:
- Flow Dynamics: Understanding the source and the complexity of pipe networks, highlighting that energy is not uniform across the system.
- Head Losses: The concept of head loss is introduced as it relates to the energy available for flow at different points within a pipe network. Bernoulli’s equation provides a framework for analyzing these losses.
- Dimensional Analysis: The factors that influence head loss are discussed, including pipe diameter, length, viscosity, and velocity. Roughness of the pipe surface is particularly significant, as it affects energy dissipation and turbulence.
- Friction Factors: The section details how friction factors vary with Reynolds numbers and relative roughness. Experimental data, particularly from Nikuradse, illustrates these relationships, shedding light on how energy losses can be calculated using the Darcy-Weisbach equation.
- Application and Implications: The practical implications of these theoretical findings are explored, especially concerning the design of efficient pipe systems, emphasizing the use of Moody's chart to determine friction factors based on Reynolds numbers and relative roughness.
Overall, this section underscores the importance of quantifying energy losses in fluid systems, as understanding these principles is vital for successful engineering applications.
Youtube Videos


![[MAE 242] Pipe flow with major and minor head losses](https://img.youtube.com/vi/WH1fn6dMYiw/mqdefault.jpg)


Audio Book
Dive deep into the subject with an immersive audiobook experience.
Understanding Pipe Systems
Chapter 1 of 11
🔒 Unlock Audio Chapter
Sign up and enroll to access the full audio experience
Chapter Content
So what they did it that to design this pipe systems like for examples, we have a water supply systems, okay. So if you have a water supply systems, there could be a source and there could be the pipe network to different locations. There will be you can imagine it that can have a very complex pipe networks supplying to water to different locations. How to design these pipe networks.
Detailed Explanation
This chunk introduces the concept of pipe systems, particularly those used for water supply. It suggests that designing a water supply system involves creating a network of pipes that connect a water source to various locations. The complexity of these networks can vary, impacting how water is distributed.
Examples & Analogies
Think of a city's water supply like a web of roads connecting different neighborhoods. Just as roads can be complex with multiple routes, intersections, and exits, water supply systems have numerous pipes directing water to homes, parks, and schools.
Energy Losses in Pipe Flow
Chapter 2 of 11
🔒 Unlock Audio Chapter
Sign up and enroll to access the full audio experience
Chapter Content
So now it is coming it that we can find out how much energy losses, how the head losses in the pipe flow systems. You can know the how much of energy loss is here, how much of energy loss is here, how much of energy loss is here, then I can quantify it the energy availability at different parts. That energy availability will give us the flow is coming or not coming it.
Detailed Explanation
This chunk discusses the concept of energy losses – specifically, head losses – in pipe flow systems. Head loss refers to the reduction in energy of the fluid due to friction and other factors within the pipe network. Understanding where and how much energy is lost is crucial as it affects whether adequate flow can reach different points in the system.
Examples & Analogies
Imagine filling a balloon with water. If you squeeze the balloon, some water might leak out because of pressure changes – similar to how energy can be lost in a pipe due to friction. If too much energy is lost, water might not reach the intended destinations, just like some areas of your yard might not get enough water if the hose has too many kinks.
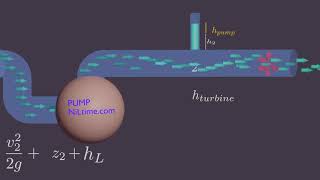
Bernoulli’s Equation and Head Loss
Chapter 3 of 11
🔒 Unlock Audio Chapter
Sign up and enroll to access the full audio experience
Chapter Content
This is quite analogous to your power transmissions, electrical power transmissions like similar way. But here we are talking about the head losses the energy losses in a pipe network or in pipe flow. Now come it to that. So we needs to do the experiment to quantify energy losses and that in terms of head loss. That means in terms of Bernoulli’s equations point of view we are talking about head loss.
Detailed Explanation
In this chunk, the speaker draws an analogy between energy loss in pipe flow and energy loss in electrical power transmission systems, suggesting similar principles apply. It emphasizes that to accurately measure and understand head loss, experiments must be conducted, often involving Bernoulli’s principle, which relates pressure, velocity, and elevation in fluid dynamics.
Examples & Analogies
Think of a garden hose. When the water moves quickly through it, the pressure at the end of the hose is high, but if you pinch the hose, the flow decreases, similar to how increased friction in a pipe reduces the available energy (head loss). This is analogous to how electrical systems lose power over distance.
Dimensional Analysis of Energy Loss
Chapter 4 of 11
🔒 Unlock Audio Chapter
Sign up and enroll to access the full audio experience
Chapter Content
Now let us now what we are doing it first the dimensional analysis. So if there is a pressure drop along a pipe in a turbulent flow depends upon the following quantities. Pipe diameters, length of the pipe okay diameters, the length of the pipe, coefficient of viscosity, and average velocity rho and the small e represents the average variations in pipe radius.
Detailed Explanation
This part discusses the concept of dimensional analysis, which helps define the variables involved in calculating pressure drop in turbulent flow. It mentions important factors such as pipe diameter, length, viscosity, and average velocity. Understanding these variables can help predict how much pressure will drop as fluid moves through the pipe.
Examples & Analogies
Imagine trying to squeeze a jelly-filled balloon through a narrow opening. The balloon's size (diameter), the tension you apply (length), and how quickly you push (velocity) all affect whether the jelly flows out easily or gets stuck. Similarly, these variables determine how fluids behave in pipes.
Effects of Pipe Roughness on Energy Loss
Chapter 5 of 11
🔒 Unlock Audio Chapter
Sign up and enroll to access the full audio experience
Chapter Content
If you look at the pipe the different pipe will have a different roughness like this glass surface maybe looks for me is a smooth surface. But if you look at microscopically there is a roughness is there. That means if I take the surface for my hand it may looks like a smooth surface, but microscopically if I look it there is a roughness is there okay.
Detailed Explanation
This section explains that the physical condition of the pipe's interior surface (its roughness) significantly affects fluid flow. Even surfaces that appear smooth to the naked eye can have microscopic irregularities that increase friction and energy loss during fluid movement. Understanding this roughness is critical for calculating the overall head loss in the system.
Examples & Analogies
Consider running your finger over different surfaces – a smooth piece of glass feels much easier to slide over compared to a rough concrete wall. Similarly, if water flows through a very rough pipe, it experiences more resistance, making it harder to push through than if it flowed through a smooth pipe.
Dimensional Analysis and Reynolds Number
Chapter 6 of 11
🔒 Unlock Audio Chapter
Sign up and enroll to access the full audio experience
Chapter Content
If you conduct a dimensional analysis, this is a non-dimensional path. This is a non-dimensional and this is the non-dimensional. Therefore, the dependent variable non-dimensional form or dependent variable this form we got it where this is the Reynolds numbers, dimensions or geometry of the pipe length and the diameters and this is with respect to the roughness height.
Detailed Explanation
Here, the discussion transitions to the relevance of the Reynolds number, a dimensionless quantity that helps predict flow patterns in different flow regimes. The behavior of flow can be characterized in terms of whether it is laminar (smooth and orderly) or turbulent (chaotic), which is crucial for understanding energy losses.
Examples & Analogies
Think of it like driving a car. At low speeds, the ride feels smooth (laminar flow), while at high speeds, the ride becomes bumpy and unstable (turbulent flow). The Reynolds number helps classify these experiences in fluid dynamics.
Friction Factor and Energy Loss Calculations
Chapter 7 of 11
🔒 Unlock Audio Chapter
Sign up and enroll to access the full audio experience
Chapter Content
So my function of h which will be a function of Reynolds numbers and e by D ratio okay? So we are replacing with an unknown function with h and which is the functions of Reynolds numbers and the roughness by D.
Detailed Explanation
This section introduces the concept of the friction factor, which quantifies how much energy is lost due to the friction between the fluid and the pipe walls. The friction factor depends on the Reynolds number and the relative roughness (e/D) of the pipe. This relationship allows engineers to predict head losses more accurately in fluid systems.
Examples & Analogies
Imagine using a sprinkler. If the nozzle is wider (similar to a large diameter pipe), the water flows out easily with less resistance. But if the nozzle is narrow, there's more pressure and turbulence, similar to how a higher friction factor increases energy loss in a system.
Darcy-Weisbach Equation
Chapter 8 of 11
🔒 Unlock Audio Chapter
Sign up and enroll to access the full audio experience
Chapter Content
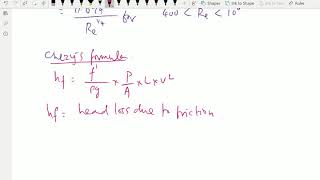
If you know these functions, then the head loss which is the Darcy-Weisbach formula is this part, which is simple part, okay. It is easy to remember it. It is that the head loss will be, h = f (L/D) (v^2 / 2g).
Detailed Explanation
This section introduces the Darcy-Weisbach equation, which is a key formula for calculating head loss due to friction in a pipe. The equation incorporates the friction factor (f), pipe length (L), diameter (D), and fluid velocity (v), and it provides a systematic way to compute energy losses. It connects various aspects discussed earlier into one cohesive formula.
Examples & Analogies
Think of it as a recipe. Just as a recipe combines ingredients (like flour, sugar, and eggs) in specific proportions to make a cake, the Darcy-Weisbach equation combines different factors to calculate the total energy loss in a piping system accurately.
Nikuradse's Experiments and Laminar Flow
Chapter 9 of 11
🔒 Unlock Audio Chapter
Sign up and enroll to access the full audio experience
Chapter Content
For the laminar flow, what it is found it the friction factor is just a inversely proportional to the Reynolds numbers and the constants is becomes 64. This is experimental finding with a conducting a series of experiment in pipes.
Detailed Explanation
This section summarizes Nikuradse's findings on laminar flow, revealing that in such flow regimes, the friction factor can be simply expressed as being inversely proportional to the Reynolds number. This highlights the predictable nature of laminar flow with significant implications for engineering and design.
Examples & Analogies
Consider a slow-moving car in a traffic jam – the slower it goes (lower Reynolds number), the easier it is to drive (lower energy loss). Conversely, as speed increases (higher Reynolds number), the effort to keep moving smoothly grows (higher friction).
Interpreting Nikuradse’s Data
Chapter 10 of 11
🔒 Unlock Audio Chapter
Sign up and enroll to access the full audio experience
Chapter Content
Now we will talk about the Nikuradse’s data for artificial roughened pipes which he conducted a series of experiments and this x axis if you look it is the Reynolds numbers and the y axis is a friction factors, the Reynolds numbers in a log scale okay.
Detailed Explanation
This section discusses how Nikuradse collected data on friction factors relative to Reynolds numbers using artificially roughened pipes. By plotting this information, one can visualize the relationship between flow regime (laminar to turbulent) and the resulting friction factors. This graph provides insights into how pipe roughness influences fluid flow and energy losses.
Examples & Analogies
Think about baking cupcakes: if you use a smooth muffin tray (representing low roughness), the batter evenly distributes with less effort. But if the tray has lumps (high roughness), the batter can get stuck, causing a bumpy ride—just like how friction impacts water flow in pipes.
Moody Chart and Practical Applications
Chapter 11 of 11
🔒 Unlock Audio Chapter
Sign up and enroll to access the full audio experience
Chapter Content
Now let us tell you that how you use this Moody’s charts for real applications. For a real applications, first you compute for a particular discharge and the mu and the rho you can compute what will be the Reynolds numbers.
Detailed Explanation
The Moody chart is a tool used to determine friction factors based on the Reynolds number and relative roughness of pipes. To use it in practical applications, one must calculate key parameters (like discharge, viscosity, density) to find the Reynolds number and subsequently refer to the Moody chart for the relevant friction factor.
Examples & Analogies
Using a navigation app, you first input your starting location and destination (similar to calculating discharge and other properties) to determine the best route (the desired friction factor) based on road conditions (like relative roughness) along the way.
Key Concepts
-
Head Loss: The reduction in energy of the fluid due to friction.
-
Friction Factor: Influences how much energy is lost in a pipe system based on flow conditions.
-
Reynolds Number: A dimensionless number indicating the type of flow (laminar or turbulent).
-
Moody Chart: A tool used to determine friction factors based on flow conditions.
-
Bernoulli’s Equation: Describes the relationship between pressure, velocity, and elevation in fluid flow.
Examples & Applications
In a water supply system, if the flow through a rougher pipe increases, the head loss also increases, necessitating higher energy input to maintain flow.
Using Darcy-Weisbach equation, if a pipe system has a length of 50 meters and a diameter of 0.1 meters with a velocity of 2 m/s, we can calculate the head loss based on the friction factor derived from experimental data.
Memory Aids
Interactive tools to help you remember key concepts
Rhymes
In a pipe that’s smooth, flows so neat, / Less energy loss, flow’s a treat.
Stories
Imagine water running down a mountain. Smooth rocks allow fast flow, while rough rocks slow it down, just like smooth pipes cause less head loss than rough pipes.
Memory Tools
To remember factors of head loss: 'Dirt for Energy Loss' - D for Diameter, E for Energy losses, L for Length, and R for Roughness.
Acronyms
FLE - Friction, Length, Energy. FLE helps you remember the three critical factors influencing energy loss in pipes.
Flash Cards
Glossary
- Head Loss
The loss of energy or pressure in a flowing fluid due to friction and turbulence in the pipe.
- Friction Factor
A dimensionless number that represents the resistive forces in a fluid flow, integral to calculating head loss.
- Reynolds Number
A non-dimensional figure that helps predict flow patterns in different fluid flow situations.
- Moody Chart
A graphical representation that depicts the relationship between the friction factor, Reynolds number, and relative roughness for various fluid flows.
- Bernoulli’s Equation
A principle that describes the conservation of energy in flowing fluids, serving as a basis for analyzing flow behavior.
Reference links
Supplementary resources to enhance your learning experience.