
Summary of Key Points Discussed
Enroll to start learning
You’ve not yet enrolled in this course. Please enroll for free to listen to audio lessons, classroom podcasts and take practice test.
Interactive Audio Lesson
Listen to a student-teacher conversation explaining the topic in a relatable way.
Pipe Networks and Energy Losses
🔒 Unlock Audio Lesson
Sign up and enroll to listen to this audio lesson

Today, we're going to learn about water supply systems and how pipe networks operate. Can anyone explain what we mean by 'energy losses' in these systems?

Isn't it about the energy that is lost due to friction as water moves through the pipes?
Exactly, Student_1! Energy losses are primarily due to friction, which reduces the efficiency of the flow. Remember the acronym 'FLEEC' for Friction Loss Energy due to flow in the pipes.

How do we actually quantify these energy losses?
Great question, Student_2! We can use Bernoulli's equation to help us find these losses. Now, can anyone recall what Bernoulli’s equation involves?

It relates pressure, velocity, and height in fluid flow, right?
That's right! And by applying it to different sections of a pipe, we can determine how energy is lost. Let's keep this principle in mind as we move forward.

Can we also compare it with electrical systems like the text mentions?
Yes! It's similar; just like electrical systems lose energy in transmission, our pipe systems face similar challenges. This analogy helps visualize the concept better.
To summarize, today we learned about the complexities of pipe networks and energy losses and how to approach quantifying them.
Dimensional Analysis and Friction Factors
🔒 Unlock Audio Lesson
Sign up and enroll to listen to this audio lesson

Now, let’s examine dimensional analysis! Why is it important when dealing with turbulent flow?
It helps us relate different variables like diameter and velocity to understand flow patterns.
Exactly! Dimensional analysis allows us to form relationships between variables. Can anyone tell me some key variables we should consider?
Pipe diameter and length?
And the viscosity of the fluid!
Perfect! All these factors contribute to pressure losses in pipes. Remember, we denote pipe roughness with 'e'.
How does roughness affect the flow?
Good question, Student_4! Increased roughness creates more turbulence which leads to higher energy losses. Think of it like trying to slide on a rough surface compared to a smooth one.
Let’s consolidate our understanding. Dimensional analysis helps us understand the relationships in turbulent flow, and pipe roughness significantly impacts flow efficiency.
Friction Factors and Experiments
🔒 Unlock Audio Lesson
Sign up and enroll to listen to this audio lesson
Next, we're going to discuss friction factors. What role do they play in our calculations?
Friction factors help us calculate the head loss across a pipe!
Correct! These factors are influenced by Reynolds numbers and roughness ratio. Can someone define Reynolds number for us?
It's a dimensionless number that helps predict flow patterns in different fluid flow situations.
Excellent! Now, we learned about Nikuradse’s experiments earlier. What did his experiments show us?
They illustrated how friction factors vary with Reynolds numbers and roughness?
Correct again! The results from those experiments allow us to apply the Darcy-Weisbach equation effectively. Can anyone tell me what that equation calculates?
It calculates head loss in a pipe due to friction!
Right! To sum up, today we underscored the significance of friction factors, their derivation, and practical applications to calculate head losses.
Moody Chart and Real Applications
🔒 Unlock Audio Lesson
Sign up and enroll to listen to this audio lesson
Finally, let’s discuss the Moody Chart and how it's utilized in practical applications. Who can tell me what it is?
It's a graphical representation of friction factors for different types of pipes!
Exactly! It helps engineers determine friction loss quickly using Reynolds numbers. How do we locate the friction factor on the chart?
We find the Reynolds number on the chart and then look at the relative roughness.
Correct! By finding those points, we can accurately estimate head loss. Why is this important for engineers?
It makes the physical layout and design of pipelines more efficient!
Precisely! It saves time and helps ensure proper design for fluid transport. Let’s recap; today we understood the Moody Chart's utility in practical applications.
Introduction & Overview
Read summaries of the section's main ideas at different levels of detail.
Quick Overview
Standard
The section provides an overview of the complexities involved in designing water supply systems, including the importance of understanding energy losses and head losses in pipe networks. It discusses methods to quantify these losses and introduces concepts of turbulent flow and friction factors.
Detailed
Detailed Summary
In section 5.1, we explore the design intricacies of water supply systems, focusing primarily on the pipe networks through which water is distributed. The section begins with a discussion on how these systems can be complex and the significance of quantifying energy losses caused by head losses in pipe flow. Energy availability in various parts of the pipe network determines whether flow is adequate,
The text draws an analogy to electrical power transmission, emphasizing that, much like electrical systems, fluid systems experience energy losses that impact efficiency. Bernoulli’s equations play a crucial role in understanding head losses, particularly in turbulent flow scenarios. The importance of dimensional analysis is introduced, highlighting how variables like pipe diameter, length, viscosity, and average velocity influence pressure drops in fluid systems.
The section also addresses the concept of roughness in pipes, which affects turbulence and energy loss. The impact of pipe roughness is illustrated through dimensional analysis, leading to the introduction of friction factors, which are variables influenced by Reynolds numbers and the roughness-to-diameter ratio. Additionally, the section concludes with examination of experimental data and key insights from Nikuradse’s experiments on friction factors, providing a comprehensive overview of how these concepts are integral to engineering fluid systems.
Youtube Videos


Audio Book
Dive deep into the subject with an immersive audiobook experience.
Water Supply Systems and Pipe Networks
Chapter 1 of 6
🔒 Unlock Audio Chapter
Sign up and enroll to access the full audio experience
Chapter Content
So what they did it that to design this pipe systems like for examples, we have a water supply systems, okay. So if you have a water supply systems, there could be a source and there could be the pipe network to different locations. There will be you can imagine it that can have a very complex pipe networks supplying to water to different locations. How to design these pipe networks.
Detailed Explanation
This chunk explains how water supply systems are structured. A water supply system includes a source (like a reservoir or water treatment plant) and a network of pipes that transport water to various locations. Designing these pipe networks can be complex, as they need to deliver adequate pressure and flow rates to ensure that water reaches all areas efficiently.
Examples & Analogies
Think of a city's water supply like a tree. The source is the trunk, providing strength, while the branches are branching pipes leading to different neighborhoods. Just like how a tree needs a strong trunk to support its branches, a water supply system requires a solid main pipe to effectively deliver water to all homes.
Energy Losses in Pipe Flow
Chapter 2 of 6
🔒 Unlock Audio Chapter
Sign up and enroll to access the full audio experience
Chapter Content
So now it is coming it that we can find out how much energy losses, how the head losses in the pipe flow systems. You can know the how much of energy loss is here, how much of energy loss is here, how much of energy loss is here, then I can quantify it the energy availability at different parts. That energy availability will give us the flow is coming or not coming it.
Detailed Explanation
This section addresses the importance of understanding energy and head losses in pipe systems. Energy loss occurs due to friction and turbulence as water flows through the pipes. By measuring these losses, engineers can determine whether there is enough energy for the water to flow effectively at different sections of the pipe network.
Examples & Analogies
Imagine trying to drink through a straw with a kink in it. The kink creates friction, making it harder for you to suck the drink up. Similarly, in a water supply system, if the pipes have obstructions or are too narrow, energy is lost, affecting the flow of water.
Turbulence and Average Variables
Chapter 3 of 6
🔒 Unlock Audio Chapter
Sign up and enroll to access the full audio experience
Chapter Content
Now come it to that. So we needs to do the experiment to quantify energy losses and that in terms of head loss. That means in terms of Bernoulli’s equations point of view we are talking about head loss.
Detailed Explanation
This chunk emphasizes the importance of experiments to measure energy losses in pipes, especially due to turbulent flow. The document refers to Bernoulli’s equation, which helps relate the pressure, velocity, and height of fluid flow. Understanding head loss is crucial for predicting how much energy is lost as water flows.
Examples & Analogies
Consider a waterslide at a water park. Once you reach a certain speed due to gravity (Bernoulli’s principle), you can get an idea of how far you will slide down. Similarly, engineers use Bernoulli’s equation to predict how head loss affects water flow in pipes.
Dimensional Analysis of Flow
Chapter 4 of 6
🔒 Unlock Audio Chapter
Sign up and enroll to access the full audio experience
Chapter Content
Now let us now what we are doing it first the dimensional analysis. So if there is a pressure drop along a pipe in a turbulent flow depends upon the following quantities. Pipe diameters, length of the pipe okay diameters, the length of the pipe.
Detailed Explanation
This section introduces dimensional analysis to study the pressure drop in turbulent flow. It notes that important factors include pipe diameter and length, viscosity, and flow velocity. By analyzing these dimensions, engineers can determine how they impact the flow characteristics within the pipe system.
Examples & Analogies
Imagine using different widths of hoses to water your garden. A wider hose means a stronger flow with less pressure drop, whereas a longer, narrower hose restricts the flow more, making it harder for water to come out. This reflects how dimensional analysis helps understand flow behavior in pipes.
Effects of Pipe Surface Roughness
Chapter 5 of 6
🔒 Unlock Audio Chapter
Sign up and enroll to access the full audio experience
Chapter Content
If you have a roughness in the pipes, then you have a more problems behavior happens it. More energy dissipates it. Smooth the pipes less the energy dissipate, the less turbulence behavior happens it.
Detailed Explanation
This chunk discusses how the roughness of pipe surfaces affects energy dissipation. Rougher pipe surfaces increase resistance, causing more energy loss as flow becomes turbulent. Conversely, smoother surfaces allow for more efficient flow with reduced turbulence.
Examples & Analogies
Think of riding a bike on different surfaces. Riding on a smooth road allows you to go faster with less effort. However, if you're on a rough gravel path, you'll have to pedal harder to maintain the same speed. In pipes, smoother surfaces enable better flow, while rough surfaces create more resistance.
Moody Chart and Friction Factors
Chapter 6 of 6
🔒 Unlock Audio Chapter
Sign up and enroll to access the full audio experience
Chapter Content
This is the Moody chart compiles for conducting series of experiment in using commercial pipes or artificially roughened pipe. So again plotting with the Reynolds numbers and the friction factors.
Detailed Explanation
This part introduces the Moody chart, which is a graphical representation that summarizes the relationship between Reynolds numbers and friction factors for various pipe roughness. It helps engineers to estimate pressure drops in pipelines based on flow conditions and pipe characteristics.
Examples & Analogies
Using the Moody chart is like using a cookbook to determine how long to bake a cake based on the ingredients you have. It provides a quick way to find out how changes in flow and pipe conditions will impact performance, ensuring you achieve the desired results in your system.
Key Concepts
-
Energy Losses: Reduction in energy due to friction and turbulence in pipes.
-
Head Loss: Loss of pressure represented as the energy required to overcome friction in fluid flow.
-
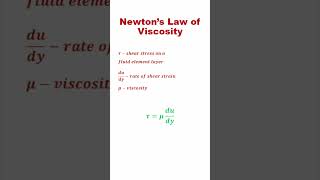
Bernoulli's Equation: Relates pressure, velocity, and height in fluid dynamics.
-
Friction Factors: Measure of how much resistance flow faces in pipes based on characteristics such as roughness and flow type.
-
Reynolds Number: A dimensionless number critical in analyzing flow regimes.
Examples & Applications
When water flows through a pipe, energy is lost due to friction against the pipe walls, which can be calculated using Bernoulli’s equation.
In a laboratory setting, experiments on pipe flow can determine the friction factors for various materials and diameters.
Memory Aids
Interactive tools to help you remember key concepts
Rhymes
In the pipes where the water flows, energy loss is what we know!
Stories
Once upon a time in a water supply system, a wise engineer calculated head losses and found that rough pipes caused much turbulence, and thus energy was lost!
Memory Tools
Friction Loss Energy (FLEEC) for remembering energy loss due to friction.
Acronyms
Remember 'SKIR' for the four key components
Surface Roughness
Kinematic viscosity
Inertia (related to velocity)
Reynolds number.
Flash Cards
Glossary
- Energy Losses
The reduction in usable energy as fluid flows through a pipe due to friction and turbulence.
- Head Loss
The loss of energy in a fluid system due to friction, turbulence, and other factors, expressed as a vertical height of a fluid column.
- Bernoulli's Equation
A principle that relates the pressure, velocity, and elevation in flowing fluids for ideal conditions.
- Friction Factor
A dimensionless quantity that describes the resistance to flow in a pipe, dependent on the flow's turbulence and pipe roughness.
- Reynolds Number
A dimensionless number that predicts flow patterns in different fluid flow situations, differentiating between laminar and turbulent flow.
Reference links
Supplementary resources to enhance your learning experience.