
Friction Factors in Laminar Flow
Enroll to start learning
You’ve not yet enrolled in this course. Please enroll for free to listen to audio lessons, classroom podcasts and take practice test.
Interactive Audio Lesson
Listen to a student-teacher conversation explaining the topic in a relatable way.
Understanding Energy Losses
🔒 Unlock Audio Lesson
Sign up and enroll to listen to this audio lesson

Today, we’re exploring the energy losses that occur in pipe systems due to friction. Why do you think it’s important to assess energy loss in a water supply network?

I think it helps in managing the efficiency of the system.
Exactly! Evaluating energy losses helps ensure that water reaches its destination effectively. Can anyone tell me what we use to calculate energy loss in this context?

Is it Bernoulli’s equation?
That's correct! We apply Bernoulli’s equation to determine head loss, which is a crucial aspect of our calculations. Head loss is influenced by the friction factor, but what do you think this friction factor indicates?

Is it related to the roughness of the pipe?
Excellent point! The friction factor is affected by the roughness of the pipe surface. The smoother the pipe, the lower the friction factor, leading to less energy loss.
So, to summarize: Assessing energy loss in pipe systems is essential for efficiency, and we utilize Bernoulli’s equation to calculate head loss affected by friction factors, which relate to the roughness of the pipe.
Dimensional Analysis
🔒 Unlock Audio Lesson
Sign up and enroll to listen to this audio lesson

Now let’s talk about the factors involved in determining head loss pressure in turbulent flow. What do you think influences the pressure drop along a pipe?

The diameter and length of the pipe should matter, right?
Exactly! The diameter and length of the pipe, as well as the fluid’s viscosity and average velocity, are pivotal. But what role does pipe roughness play?
More roughness means more energy is lost because of turbulence?
Yes! Surface roughness increases turbulence and causes more energy dissipation. When we analyze all these factors together, what non-dimensional parameter do we get?
Is it Reynolds number?
Right! The Reynolds number helps us understand the flow regime, how viscous a fluid is in motion through a particular diameter and roughness, and assists in calculating the friction factor.
In summary, we analyze factors like diameter, length, viscosity, velocity, and roughness to understand energy losses through the Reynolds number.
Friction Factors in Laminar Flow
🔒 Unlock Audio Lesson
Sign up and enroll to listen to this audio lesson
Let’s delve into the friction factor in laminar flow specifically. Can anyone recall the relationship we use to find this factor?
It's inversely proportional to Reynolds number with a constant of 64, right?
Absolutely! So, the friction factor is calculated as `f = 64/Re`. Why do we think this equation is crucial for engineers?
It allows us to predict energy loss in pipes!
Correct! Knowing the friction factors helps engineers foretell head loss, which is essential for designing efficient systems. Have you heard of Nikuradse’s experiments?
Yes! He studied artificially roughened pipes, right?
Exactly! His findings enabled a more comprehensive understanding of how friction factors change with varying surface roughness. Let's wrap up today's session: The value of the friction factor in laminar flow is vital for predicting energy losses.
Practical Applications of the Moody Chart
🔒 Unlock Audio Lesson
Sign up and enroll to listen to this audio lesson
For our final session today, let’s discuss the Moody chart. How can we utilize it in practice?
Is it for determining the friction factor based on Reynolds number and pipe roughness?
Exactly! By knowing the Reynolds number and relative roughness, we can interpolate values from the chart. What happens to the friction factor as roughness increases?
It increases, leading to higher energy loss, right?
Correct! The higher the roughness, the greater the friction factor and energy loss we can expect. In summary, the Moody chart is a crucial tool for engineers to analyze and design pipe systems efficiently.
Introduction & Overview
Read summaries of the section's main ideas at different levels of detail.
Quick Overview
Standard
The section explains how to assess energy losses in laminar flow through complex pipe networks. It introduces the key concepts of friction factors, Bernoulli’s equations, and the impact of pipe roughness on energy dissipation.
Detailed
Friction Factors in Laminar Flow
This section delves into the friction factors associated with laminar flow in pipe systems and how these factors impact energy loss due to head loss. A complex water supply system, which could involve intricate pipe networks, serves as the foundation for understanding the importance and calculation of energy losses encountered in fluid flows.
Key Points:
- Energy Losses in Pipe Flow: Understanding how much energy is lost in different sections of a pipe network is essential for effective design and operation. The head loss due to friction factors is a critical measurement involving Bernoulli’s equations.
- Dimensional Analysis: Pressure drops in turbulent flows depend on pipe diameters, lengths, viscosity, average velocity, and pipe roughness variations. The concept introduces Reynolds numbers, which help classify flow regimes.
-
Friction Factors: In laminar flow, the friction factor (
f) is found to be inversely proportional to Reynolds numbers, with a constant of 64. This empirical relationship aids in estimating head loss in pipes according to the Darcy-Weisbach equation. - Experimental Findings: The section discusses the experimental methods used to ascertain friction factors in both laminar and turbulent flows, referencing Nikuradse's work on artificially roughened pipes, highlighting the effects of varying surface roughness on energy loss.
- Moody Chart: The section concludes with the application of the Moody chart, which helps visualize the relationship between Reynolds numbers, friction factors, and pipe roughness to determine head loss in real-world applications.
This comprehensive overview of friction factors in laminar flow lays the groundwork for subsequent discussions on fluid dynamics and engineering practices related to pipe flow management.
Youtube Videos


![Derivation of Laminar Flow Through a Pipe[Fluid Mechanics]](https://img.youtube.com/vi/KnDiV7EzLHg/mqdefault.jpg)

Audio Book
Dive deep into the subject with an immersive audiobook experience.
Understanding Pipe Systems
Chapter 1 of 8
🔒 Unlock Audio Chapter
Sign up and enroll to access the full audio experience
Chapter Content
So what they did it that to design this pipe systems like for examples, we have a water supply systems, okay. So if you have a water supply systems, there could be a source and there could be the pipe network to different locations. There will be you can imagine it that can have a very complex pipe networks supplying to water to different locations.
Detailed Explanation
This chunk introduces the concept of pipe systems, particularly focusing on complex water supply systems. It explains that these systems consist of various pipe networks that deliver water from a source to multiple locations. Understanding the design of these systems is crucial because it helps in calculating how much energy is lost and how efficiently water can be supplied.
Examples & Analogies
Think of a city's water supply system as a network of roads. Just like how cars travel through different paths to reach their destination, water flows through various pipes to reach homes and businesses. A well-designed road (or pipe) system ensures that cars (or water) can travel efficiently without getting stuck in traffic (or experiencing high energy loss).
Energy and Head Losses in Pipes
Chapter 2 of 8
🔒 Unlock Audio Chapter
Sign up and enroll to access the full audio experience
Chapter Content
So now it is coming it that we can find out how much energy losses, how the head losses in the pipe flow systems. You can know the how much of energy loss is here, how much of energy loss is here, how much of energy loss is here, then I can quantify it the energy availability at different parts.
Detailed Explanation
This part discusses the critical concept of energy losses within pipe systems. It emphasizes that by assessing various points in the pipe network, one can identify the amount of energy lost due to head loss. Head loss refers to the decrease in total mechanical energy as fluid flows through the pipe. Understanding these losses helps engineers determine if there is enough energy available for the desired flow.
Examples & Analogies
Imagine you are filling a bathtub. If the water flows smoothly, it fills up quickly, but if there are blockages in the pipes, the water flows slowly or not at all. The energy loss in this scenario relates to how efficiently your water flows and how many twists and turns the pipes have—just like how head loss occurs in longer or more complicated pipe systems.
Dimensional Analysis and Variables
Chapter 3 of 8
🔒 Unlock Audio Chapter
Sign up and enroll to access the full audio experience
Chapter Content
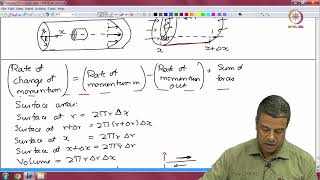
Now let us now what we are doing it first the dimensional analysis. So if there is a pressure drop along a pipe in a turbulent flow depends upon the following quantities. Pipe diameters, length of the pipe okay diameters, the length of the pipe is similar to the coefficient of viscosity, familiar to the coefficient of viscosity and average velocity rho and the small e represents the average variations in pipe radius.
Detailed Explanation
This chunk introduces dimensional analysis and its role in understanding pressure drops in turbulent pipe flow. It lists factors that affect pressure drop, including pipe diameter, length, viscosity, average velocity, and variations in pipe radius. Dimensional analysis is crucial as it helps in creating non-dimensional numbers that simplify the relationship between these variables.
Examples & Analogies
Consider baking a cake. The diameter and height of the cake pan, the batter's viscosity, and even the oven's temperature all affect how well your cake rises. Similarly, in fluid flow, the dimensions and properties of the pipes influence how easily the fluid can move, affecting overall performance and efficiency.
Impact of Pipe Roughness
Chapter 4 of 8
🔒 Unlock Audio Chapter
Sign up and enroll to access the full audio experience
Chapter Content
If you look at the pipe, the different pipe will have a different roughness like this glass surface maybe looks for me is a smooth surface. But if you look at microscopically there is a roughness is there. That means if I take the surface for my hand it may looks like a smooth surface, but microscopically if I look it there is a roughness is there okay.
Detailed Explanation
This section discusses pipe roughness, emphasizing that even surfaces that appear smooth can have microscopic irregularities. These slight differences in texture can significantly affect fluid flow, as rougher surfaces create more turbulence and lead to greater energy losses. Understanding how roughness affects flow is essential for designing efficient pipe systems.
Examples & Analogies
Think about skin. While your skin may feel smooth to the touch, if you looked closely, you'd notice tiny bumps and pores. Similarly, pipes might seem smooth, but these small imperfections cause friction and turbulence in the flowing water, which can slow it down and waste energy.
Friction Factors and Their Dependence
Chapter 5 of 8
🔒 Unlock Audio Chapter
Sign up and enroll to access the full audio experience
Chapter Content
Just these equations if I further simplified it that if this friction factor is a function of Reynolds numbers and e by D ratio okay? So we are replacing with a unknown function with h.
Detailed Explanation
Here, friction factors are discussed as key indicators of flow behavior in pipes. The friction factor depends on Reynolds numbers and the ratio of roughness to diameter. These relationships can be captured in equations, allowing engineers to predict how much friction will affect the flow based on specific conditions. Understanding friction factors is crucial for designing systems that minimize energy loss.
Examples & Analogies
Similar to how road conditions affect vehicle speed, the roughness and shape of pipes influence how easily water flows. If the road is smooth, your car accelerates easily, but if it's bumpy, your ride slows down. In pipes, a lower friction factor indicates smoother flow, while a higher factor suggests more resistance.
Experimental Relationships and the Darcy-Weisbach Equation
Chapter 6 of 8
🔒 Unlock Audio Chapter
Sign up and enroll to access the full audio experience
Chapter Content
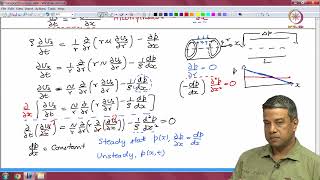
If you know these function, then the head loss which is the Darcy-Weisbach formula is this part, which is simple part, okay. It is easy to remember it. It is that the head loss will be expressed as h = f * (L/D) * (V^2/2g).
Detailed Explanation
The Darcy-Weisbach equation provides a straightforward way to calculate head loss in pipe systems. It expresses head loss as a function of the friction factor (f), the ratio of pipe length to diameter (L/D), and the velocity of the fluid (V). This equation is fundamental for engineers to determine how much energy is required to overcome friction in pipes.
Examples & Analogies
Imagine a bicycle ride where you are going uphill. The steeper the hill (like higher friction), the more effort (energy) you need to exert to reach the top. The Darcy-Weisbach equation helps you predict how much energy you'll need based on facts like how steep the incline is (head loss) and how quickly you are pedaling (velocity).
Nikuradse's Friction Factor Findings
Chapter 7 of 8
🔒 Unlock Audio Chapter
Sign up and enroll to access the full audio experience
Chapter Content
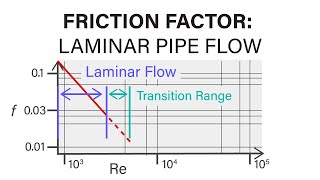
For the laminar flow, what it is found it the friction factor is a just a inversely proportional to the Reynolds numbers and the constants is becomes 64.
Detailed Explanation
Nikuradse's experiments revealed that for laminar flow, the friction factor is inversely proportional to the Reynolds number. This means that as the fluid becomes more turbulent (higher Reynolds number), the friction factor decreases, simplifying to a constant value, 64. This foundational understanding is critical for engineers to predict how fluid behaves in pipes under laminar flow conditions.
Examples & Analogies
Consider swimming in a pool. If you swim slowly (laminar flow), you feel less resistance, similar to low friction in pipes. But if you start splashing around rapidly (turbulent flow), the water pushes back against you more, just as it increases friction in pipe flow.
Moody Chart for Friction Factors
Chapter 8 of 8
🔒 Unlock Audio Chapter
Sign up and enroll to access the full audio experience
Chapter Content
Now we will talk about the Nikuradse’s data for artificial roughened pipes. These are the experiment data from artificial roughened pipes.
Detailed Explanation
This chunk introduces the Moody chart, a graphical representation derived from Nikuradse's data, showing the relationship between Reynolds numbers and friction factors for both roughened and smooth pipes. By analyzing this chart, engineers can determine the expected friction factor for various pipe conditions, which aids in system design and energy loss calculations.
Examples & Analogies
Think of a weather chart that predicts temperatures based on humidity and wind. The Moody chart serves a similar purpose in helping engineers predict how roughness and flow conditions affect the energy efficiency of pipes. Just as you would dress differently based on weather conditions, engineers adjust their designs based on friction factors indicated by the Moody chart.
Key Concepts
-
Head Loss: A measure of energy loss per unit weight due to friction in a fluid flow.
-
Friction Factors: Dimensionless numbers that quantify the resistance to flow due to pipe surface roughness.
-
Reynolds Number: A ratio that helps classify the flow as laminar, transitional, or turbulent.
-
Dimensional Analysis: A technique for comparing different physical quantities in fluid mechanics.
-
Bernoulli's Equation: An equation representing the conservation of energy for flowing fluids.
-
Moody Chart: A tool for finding the friction factor in pipe flow based on Reynolds number and relative roughness.
Examples & Applications
In a water supply system where numerous pipes are interconnected, engineers can calculate expected head loss in each segment using friction factors derived from flow conditions.
Nikuradse's experiments using sandpaper to create roughened pipe surfaces demonstrated how increased roughness elevates energy loss, confirming the relationship between friction factors and surface texture.
Memory Aids
Interactive tools to help you remember key concepts
Rhymes
In pipes that flow, let friction show; rough and smooth, energy's the clue, make heads less low!
Stories
Imagine a water supply system like a network of roads. Vehicles (water) face friction (head loss) based on whether the roads (pipes) are smooth or rough. The more bumps (roughness), the harder the ride (more energy loss).
Memory Tools
REH (Roughness, Energy, Head loss) - Remember Rivers Experience Head loss as they flow through various terrains.
Acronyms
FIRE (Friction, Inverse to Reynolds, Energy loss) - Recall how friction factors increase inverse to Reynolds number, affecting energy loss.
Flash Cards
Glossary
- Head Loss
The loss of energy in a fluid flow system due to friction, typically expressed in terms of height.
- Friction Factor
A dimensionless number used to calculate the head loss due to friction in a pipe.
- Reynolds Number
A dimensionless quantity that helps predict flow patterns in different fluid flow situations.
- Dimensional Analysis
A mathematical technique used to reduce physical relationships to dimensionless parameters.
- Bernoulli's Equation
A principle that describes the relationship between pressure, velocity, and height in fluid dynamics.
- Moody Chart
A graphical representation used in fluid mechanics to determine friction factors based on Reynolds numbers and relative roughness.
Reference links
Supplementary resources to enhance your learning experience.