
Interpreting the Effects of Roughness on Energy Losses
Enroll to start learning
You’ve not yet enrolled in this course. Please enroll for free to listen to audio lessons, classroom podcasts and take practice test.
Interactive Audio Lesson
Listen to a student-teacher conversation explaining the topic in a relatable way.
Introduction to Pipe Systems and Energy Losses
🔒 Unlock Audio Lesson
Sign up and enroll to listen to this audio lesson

Today, let's discuss how we design systems for water supply. One important aspect is understanding energy losses that occur in the pipe flow.

What do you mean by energy losses in a pipe?
Great question! Energy losses, or head losses, refer to the energy that is lost due to friction and turbulence as water flows through pipes.

How do we measure that energy loss?
We quantify it through measurements of pressure drops and applying Bernoulli’s equation to understand the dynamics of fluid flow.

So, is it similar to how electricity is transmitted?
Yes! Just like power transmission, we need to analyze how energy is lost in hydraulic systems.
To wrap up, the basic concepts we discussed involve head losses, pressure drop, and energy availability — vital for designing efficient pipe networks.
Understanding Roughness and Its Effects
🔒 Unlock Audio Lesson
Sign up and enroll to listen to this audio lesson

Let's talk about how roughness affects energy losses in pipes. Even a pipe that looks smooth can have microscopic roughness.
Why does that roughness matter?
Rough surfaces increase turbulence which raises friction and, subsequently, energy dissipation.
How do we measure this roughness?
We often express it as a ratio of roughness height to the diameter of the pipe, noted as e/D.
What happens if the roughness increases further?
If the roughness increases significantly, it could lead to higher turbulence, thus increasing energy losses one might have to consider.
In summary, increased roughness leads to more turbulence and energy loss, making the optimization of pipe materials critical.
Dimensional Analysis and Friction Factors
🔒 Unlock Audio Lesson
Sign up and enroll to listen to this audio lesson
Now, let's focus on dimensional analysis for analyzing energy losses in pipes.
What is the purpose of dimensional analysis in this context?
Dimensional analysis helps to identify how different factors like diameter, roughness, and flow velocity interact to affect energy losses.

Does this help us formulate any equations?
Exactly! It leads us to the derivation of friction factors, which stem from experiments and relate directly to Reynolds numbers and roughness ratios.
How do we apply this practically?
Using the Darcy-Weisbach equation allows us to compute head losses if we know the friction factor.
In summary, dimensional analysis links several aspects of pipe flow and is crucial for deriving equations for head losses.
Practical Applications and Moody Chart
🔒 Unlock Audio Lesson
Sign up and enroll to listen to this audio lesson
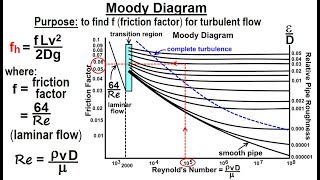
Finally, let's look at practical applications, specifically the Moody chart.
What is the Moody chart?
The Moody chart presents experimental data on friction factors in relation to Reynolds numbers for different pipe roughnesses.
How do we use it?
You can determine the friction factor from the chart based on the given Reynolds number and relative roughness.
What else should we consider while using it?
It's crucial to ensure you're using the right type of pipe and understanding how roughness impacts energy losses.
In conclusion, the Moody chart is a vital tool that summarizes how roughness and flow interact to impact energy losses.
Introduction & Overview
Read summaries of the section's main ideas at different levels of detail.
Quick Overview
Standard
In this section, the relationship between pipe surface roughness and hydraulic energy losses is discussed, focusing on head loss calculations. The concepts of turbulence, friction factors, and the significance of dimensional analysis for design and maintenance of pipe networks are emphasized.
Detailed
In fluid mechanics, particularly in the design of pipe systems for water supply, understanding energy and head losses is crucial. This section delves into how the roughness of pipes affects energy dissipation during turbulent flow. By examining the relationship between pipe diameter, length, average velocity, and roughness height, we explore how different pipe surface characteristics influence the energy losses experienced along the flow path. Dimensional analysis showcases the dependence of pressure drop on these variables, leading to the introduction of friction factors as a critical component in calculating head losses using the Darcy-Weisbach equation. Experimental data illustrates the non-linear relationship between Reynolds numbers and friction factors, especially in cases of varying roughness, guiding practical applications in choosing materials and optimizing fluid transport systems.
Youtube Videos


Audio Book
Dive deep into the subject with an immersive audiobook experience.
Energy Losses in Pipe Systems
Chapter 1 of 6
🔒 Unlock Audio Chapter
Sign up and enroll to access the full audio experience
Chapter Content
So what they did it that to design this pipe systems like for examples, we have a water supply systems, okay. So if you have a water supply systems, there could be a source and there could be the pipe network to different locations. There will be you can imagine it that can have a very complex pipe networks supplying to water to different locations. How to design these pipe networks. So now it is coming it that we can find out how much energy losses, how the head losses in the pipe flow systems. You can know the how much of energy loss is here, how much of energy loss is here, how much of energy loss is here, then I can quantify it the energy availability at different parts. That energy availability will give us the flow is coming or not coming it. And that is what do we do it?
Detailed Explanation
This section talks about the design of pipe systems, particularly water supply systems. In such systems, energy losses and head losses occur as water flows through the pipes. Understanding where and how much energy is lost helps in quantifying the availability of energy at various locations in the system. The flow dynamics can be complex due to the interconnected nature of pipe networks, and analyzing energy losses allows engineers to assess if the system is functioning properly or if adjustments are necessary.
Examples & Analogies
Think of a water supply system like a subway network; each station represents a junction within the pipe network. Just as a subway system needs energy to move trains between stations, water requires energy to flow through pipes. If energy is lost at certain junctions (like delays in subway trains), it can affect the entire system. Engineers need to monitor and adjust these energy losses to keep water flowing smoothly to all areas.
Understanding Head Loss
Chapter 2 of 6
🔒 Unlock Audio Chapter
Sign up and enroll to access the full audio experience
Chapter Content
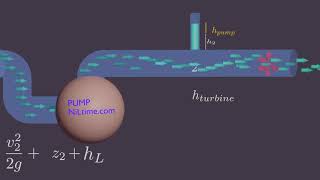
This is quite analogous to your power transmissions, electrical power transmissions like similar way. But here we are talking about the head losses the energy losses in a pipe network or in pipe flow. Now come it to that. So we needs to do the experiment to quantify energy losses and that in terms of head loss. That means in terms of Bernoulli’s equations point of view we are talking about head loss.
Detailed Explanation
This part of the text draws an analogy between energy losses in pipe systems and losses in electrical power transmission. In fluid dynamics, head loss refers to the loss of energy due to friction and turbulence as fluid flows through a pipe. To quantify this loss, experiments are conducted, often utilizing Bernoulli's equation, which relates pressure, velocity, and height of fluid in a pipe. Understanding head loss is essential for effective pipe network design.
Examples & Analogies
Consider riding a bike on a bumpy road versus a smooth one. On the bumpy road, you expend more energy to maintain speed because of the added friction and obstacles. Similarly, as fluid moves through pipe roughness, it loses energy (or head) because it's akin to experiencing 'bumps' in the flow route. Understanding head loss helps engineers design smoother pipe paths to reduce energy losses.
Impact of Pipe Roughness
Chapter 3 of 6
🔒 Unlock Audio Chapter
Sign up and enroll to access the full audio experience
Chapter Content
But we are looking it what will be the energy loss part. Now we look it any turbulent flow going through a pipe systems then we can easily we can make it what are the governing or depending dependent variable components. Like I have a pipe. As I have the pipe part is going through these I have to look it the average conditions the time average P and time average velocity. So we talk about the time average or mean time average pressure component.
Detailed Explanation
This segment emphasizes examining turbulent flow in pipes and how it leads to energy losses. By looking at average conditions such as pressure and velocity over time, engineers gain insights into the behavior of fluid flow in relation to pipe roughness. Pipe roughness impacts how smoothly or turbulently fluid flows, affecting the amount of energy lost.
Examples & Analogies
Imagine running a marathon; if you're running on a smooth track, you'll maintain a good speed with minimal energy loss, but if the track is rocky or uneven, you'll tire more quickly. In the same way, fluid moves more efficiently through smooth pipes than rough ones. Engineers strive to create the 'smoothest path' for fluid flow to enhance efficiency.
Dimensional Analysis of Energy Loss
Chapter 4 of 6
🔒 Unlock Audio Chapter
Sign up and enroll to access the full audio experience
Chapter Content
Now let us now what we are doing it first the dimensional analysis. So if there is a pressure drop along a pipe in a turbulent flow depends upon the following quantities. Pipe diameters, length of the pipe okay diameters, the length of the pipe is similar to the coefficient of viscosity, familiar to the coefficient of viscosity and average velocity rho and the small e represents the average variations in pipe radius.
Detailed Explanation
In this section, the focus shifts to dimensional analysis, which involves examining how different factors, such as pipe diameter, length, viscosity, and velocity, collectively influence pressure drops in turbulent flows. Understanding these relationships allows for accurate modeling of flow and energy loss in practical applications.
Examples & Analogies
Think of baking a cake: the size of the cake (diameter), the time in the oven (length of the baking process), the ingredients (viscosity), and how well you've mixed them (velocity) all determine if the cake rises or deflates. In fluid mechanics, similarly, these factors need to be balanced to predict how well a fluid flows in a pipe.
Pipe Roughness and Energy Behavior
Chapter 5 of 6
🔒 Unlock Audio Chapter
Sign up and enroll to access the full audio experience
Chapter Content
If you have a roughness in the pipes, then you have a more problems behavior happens it. More energy dissipates it. Smooth pipes less the energy dissipate, the less turbulence behavior happens it. So if you look at that if you have a pipe, we can see there is a smooth pipe, but really it is not a smooth pipe. Even if a glass panels, what you have all have a certain degree of roughness.
Detailed Explanation
This chunk illustrates the relationship between pipe roughness and energy dissipation. Rough pipes induce more turbulence, which leads to higher energy losses compared to smooth pipes where energy loss is minimized. The text highlights that even surfaces that appear smooth at a glance may have microscopic roughness affecting fluid behavior.
Examples & Analogies
Picture sliding down a playground slide; a smooth slide allows you to glide down quickly, while a slide with bumps (or a rough texture) slows you down because of increased friction. In the same manner, fluids flowing through rough pipes lose more energy due to frictional forces compared to those flowing through smooth pipes.
Friction Factors and Energy Loss Calculations
Chapter 6 of 6
🔒 Unlock Audio Chapter
Sign up and enroll to access the full audio experience
Chapter Content
We define it as a friction factors. Because for particular flow systems, you know the Reynolds numbers for a particular pipe, the type of the pipes, we know this the roughness height and the D. And since these are known to us, if I conduct a series of experiment in terms of Reynolds numbers and in terms of the roughness at D we can compute it or we can get it the friction factors. That is what it was done in earlier to conduct a series of pipe flow experiment.
Detailed Explanation
This section introduces friction factors as a critical component in determining energy loss in pipe flows. By conducting experiments under different Reynolds number conditions and knowing the pipe's roughness, engineers can calculate the friction factors that indicate how much energy is lost due to friction in the flow. This calculated friction factor is vital for practical applications in engineering.
Examples & Analogies
When budgeting for a family event, knowing how many guests (analogous to the flow rate), the type of meal (analogous to the pipe material), and other factors helps determine how much food to buy. Similarly, calculating friction factors involves understanding various system components to predict energy losses effectively in piping systems.
Key Concepts
-
Energy Loss: Refers to the energy lost due to friction and turbulence in fluid flow.
-
Head Loss: The reduction in pressure in a pipe due to energy loss.
-
Roughness: The texture of a pipe's interior surface that affects flow characteristics.
-
Friction Factor: A constant derived from empirical data used to quantify energy losses.
-
Reynolds Number: A dimensionless number that helps predict flow patterns in different fluid flow situations.
Examples & Applications
If water flows through a pipe with a rough surface, it experiences more energy loss than if it flows through a smooth pipe.
When analyzing a system for water distribution, using dimensional analysis allows engineers to derive fluid dynamics equations necessary for efficient design.
Memory Aids
Interactive tools to help you remember key concepts
Rhymes
For pipes so rough, energy's tough; turbulence found, makes flow not sound.
Stories
Imagine water flowing smoothly in a glass pipe. Suddenly, it hits a rough patch, causing it to swirl and lose energy as it fights against unseen bumps.
Memory Tools
Remember 'HARD': Head loss, Average velocity, Roughness, Darcy-Weisbach; key factors in analyzing pipe flow.
Acronyms
FREED
Friction factor
Reynolds number
Energy loss
Energy availability
Diameter; an acronym to remember critical elements of fluid flow.
Flash Cards
Glossary
- Energy Loss
The loss of energy in the fluid motion primarily due to friction and turbulence in a pipe system.
- Head Loss
The loss of pressure in a fluid system, typically measured in terms of elevation head or energy head.
- Roughness
The unevenness of a surface, significant in determining the frictional resistance in a fluid flow.
- Dimensional Analysis
A technique used to analyze the relationships between different physical quantities by identifying their fundamental dimensions.
- Friction Factor
A dimensionless number that describes the frictional resistance encountered by fluid flow in a pipe.
Reference links
Supplementary resources to enhance your learning experience.