
Disaster Management and Risk Reduction
Enroll to start learning
You’ve not yet enrolled in this course. Please enroll for free to listen to audio lessons, classroom podcasts and take practice test.
Interactive Audio Lesson
Listen to a student-teacher conversation explaining the topic in a relatable way.
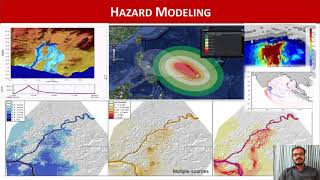
GIS in Hazard Zonation
🔒 Unlock Audio Lesson
Sign up and enroll to listen to this audio lesson

Today, we are going to dive into how GIS is used in hazard zonation. Can anyone tell me why it is essential to map risk zones?

To understand where the disasters are likely to happen!
Exactly! By knowing the hazard zones for earthquakes, landslides, floods, and industrial hazards, engineers can make informed decisions for risk management. We can use the acronym 'HERO' - Hazard Event Risk Overview - to remember important aspects of hazard zonation.

What kind of data does GIS use for this mapping?
Great question! GIS utilizes spatial datasets, including land elevation, historical disaster data, and population density. This helps in creating detailed risk maps.

How often are these maps updated?
Typically, these maps are updated regularly, especially after significant events or as new data becomes available. Using GIS allows for real-time updates and improved accuracy.

Can this mapping help during a disaster?
Absolutely! It allows emergency responders to prioritize areas that need immediate attention based on the risk levels identified in the maps. Summarizing, understanding hazard zones saves lives and allows for strategic planning.
Post-Disaster Damage Assessment
🔒 Unlock Audio Lesson
Sign up and enroll to listen to this audio lesson

Now let's shift our focus to post-disaster damage assessment. Why do you think this is so important?
To know how much damage has been done!
Correct! Post-disaster assessments are crucial because they guide disaster recovery efforts. GIS helps with rapid assessment by utilizing high-resolution imagery. Let’s think of 'RAPID' - 'Response Assessment Protocol for Immediate Damage' - to remember this process.
What tools are used for this kind of assessment?
Good question! Tools such as drones, satellite imagery, and GIS software are used to gather information quickly and accurately, allowing for efficient planning of relief operations.
How does this impact recovery planning?
Timely assessments mean quicker allocation of resources like food, medical supplies, and shelter. If we know where the damage is most severe, we can help those in need faster. So, we conclude that GIS enhances recovery management effectively.
Introduction & Overview
Read summaries of the section's main ideas at different levels of detail.
Quick Overview
Standard
In this section, we explore how GIS technology assists in identifying hazard zones for natural and industrial disasters, alongside its application in post-disaster damage assessment, highlighting the importance of rapid response and recovery planning.
Detailed
Disaster Management and Risk Reduction
Key Points
Disaster management is a critical area within civil engineering, where the application of Geographic Information Systems (GIS) plays a pivotal role. This section is structured around two central components:
- GIS in Hazard Zonation: By utilizing spatial datasets, GIS enables civil engineers to effectively map risk zones pertaining to various hazards such as earthquakes, landslides, floods, and industrial accidents. This information is vital for disaster preparedness, urban planning, and risk mitigation strategies.
- Post-Disaster Damage Assessment: Post-event analysis is crucial for timely recovery efforts. High-resolution satellite imagery and aerial surveys allow for rapid assessment of damage, helping to inform the planning of rescue operations, the allocation of resources, and the development of rebuilding strategies.
In summary, integrating GIS technology into disaster management processes enhances the ability to predict risks, assess damages, and implement effective recovery tactics.
Youtube Videos


Audio Book
Dive deep into the subject with an immersive audiobook experience.
GIS in Hazard Zonation
Chapter 1 of 2
🔒 Unlock Audio Chapter
Sign up and enroll to access the full audio experience
Chapter Content
Spatial datasets are used to map risk zones for:
- Earthquakes
- Landslides
- Floods
- Industrial hazards
Detailed Explanation
GIS (Geographic Information Systems) plays a crucial role in disaster management by helping identify and categorize areas that are at risk for different types of natural disasters. By using various spatial datasets, specialists can visualize which regions are more likely to experience earthquakes, landslides, floods, and industrial accidents.
- Data Collection: The first step involves collecting data about the geographical features of an area, such as elevation, soil type, and historical disaster occurrences.
- Mapping Risk Areas: Using GIS tools, analysts can create maps that show where these risks are highest. For example, areas near fault lines would be highlighted for earthquakes, while regions with steep slopes could be marked for landslide risks.
- Planning and Preparedness: These maps are critical for urban planning and disaster preparation, helping governments and organizations allocate resources and develop response strategies in advance.
Examples & Analogies
Imagine you own a home in a neighborhood that is prone to various natural disasters. If you have a map that shows flood zones, earthquake paths, and landslide risks, you can make an informed decision about where to build or whether to invest in specific protections like flood barriers. Similarly, cities use GIS to visualize these risks so they can create emergency protocols and ensure infrastructure is robust enough to withstand disasters.
Post-Disaster Damage Assessment
Chapter 2 of 2
🔒 Unlock Audio Chapter
Sign up and enroll to access the full audio experience
Chapter Content
High-resolution imagery is used for:
- Rapid assessment
- Planning relief and reconstruction
- Monitoring recovery progress
Detailed Explanation
After a disaster strikes, assessing the damage quickly is vital for recovery efforts. High-resolution imagery, often obtained through satellites or drones, allows officials to see the affected areas in detail without requiring immediate on-ground inspections.
- Rapid Assessment: High-resolution images can be analyzed shortly after a disaster to get a clear picture of the damage. This involves looking at buildings, roads, and other infrastructure to determine what has been destroyed or compromised.
- Planning Relief and Reconstruction: Once the extent of the damage is understood, these images help in crafting plans for relief efforts, deciding where resources should be deployed. Additionally, they provide essential data for reconstruction efforts, such as which buildings must be demolished or repaired.
- Monitoring Recovery Progress: Over time, these images can be reused to monitor how areas are recovering, assessing if reconstruction is on track or if further interventions are needed.
Examples & Analogies
Think of a large company that has a warehouse damaged in a storm. The company could dispatch inspectors to check the damage, but that takes a lot of time. Instead, they use drones to take high-resolution images of the warehouse. Within hours, they can assess the damage, create a plan to secure the site, and establish a timeline for repairs. This efficient assessment method is exactly how post-disaster analysis works with GIS technology.
Key Concepts
-
GIS in Hazard Zonation: GIS enables the mapping of risk zones for natural and industrial hazards, facilitating better preparedness.
-
Post-Disaster Damage Assessment: Utilizing high-resolution imagery, GIS aids in rapid assessment and resource allocation post-disaster.
Examples & Applications
Mapping flood zones in a city using GIS to inform urban planning and emergency response strategies.
Using satellite imagery to assess damage areas after an earthquake for efficient recovery efforts.
Memory Aids
Interactive tools to help you remember key concepts
Rhymes
When disaster strikes and danger looms, Maps will guide us through the glooms.
Stories
Once in a town, where floods rushed down, GIS saved many from a watery frown.
Memory Tools
Remember 'RAPID' for quick assessments: Response Assessment Protocol for Immediate Damage.
Acronyms
Use 'HERO' for understanding hazard zones
Hazard Event Risk Overview.
Flash Cards
Glossary
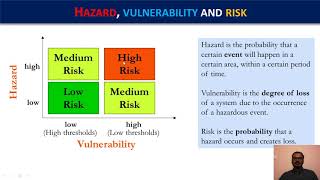
- Hazard Zonation
The process of mapping areas prone to specific hazards such as earthquakes, floods, and landslides.
- GIS (Geographic Information System)
A framework for gathering, managing, and analyzing spatial and geographic data.
- PostDisaster Damage Assessment
A process that assesses the impact of a disaster on infrastructure and communities.
Reference links
Supplementary resources to enhance your learning experience.