
JIT Compiler Tuning
Enroll to start learning
You’ve not yet enrolled in this course. Please enroll for free to listen to audio lessons, classroom podcasts and take practice test.
Interactive Audio Lesson
Listen to a student-teacher conversation explaining the topic in a relatable way.
JIT Compiler Basics
🔒 Unlock Audio Lesson
Sign up and enroll to listen to this audio lesson

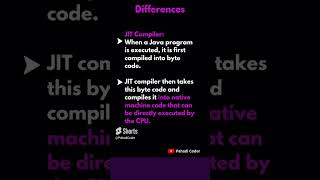
Let's start with understanding what the JIT compiler does. It optimizes the performance of Java applications by converting bytecode to native code as methods are invoked.

Why is it important to have a JIT compiler instead of just using an interpreter?
Great question! The JIT compiler significantly increases execution speed for 'hot' methods by producing optimized native code, while the interpreter runs bytecode line-by-line, which is slower.

What are some examples of 'hot' methods?
Hot methods are typically those that are called frequently, like loops or frequently accessed service methods. They benefit the most from JIT compilation.
In summary, JIT compilation turns frequently executed Java bytecode into native code, improving performance considerably.
Monitoring JIT Compilation
🔒 Unlock Audio Lesson
Sign up and enroll to listen to this audio lesson

To fine-tune performance, we can enable profiling using the `-XX:+PrintCompilation` flag. Can anyone tell me what this does?

It shows which methods have been compiled, right?
Exactly! This information is essential for identifying hot methods that might need optimization. Why do you think profiling regularly could be beneficial?

It helps in finding out which methods are slow or need improvement.
Correct! Effective use of profiling can lead to a significant boost in performance.
So, we need to regularly monitor to capture potential bottlenecks.
Manual Optimization Techniques
🔒 Unlock Audio Lesson
Sign up and enroll to listen to this audio lesson
After viewing the compiled methods, what do you think should be our next step for those hot methods?
We should optimize them!
Yes, methods can be optimized through several techniques. For example, one is method inlining. Can someone explain what method inlining does?
It replaces the method call with the actual method code, right?
Exactly! This reduces the overhead of method calls. Additionally, we should also look out for redundant calculations or repeated code within those hot methods.
Why is it important to look for redundancies?
Eliminating redundancies can lead to cleaner and faster code, thus improving performance. Let’s summarize—monitoring and optimizing hot methods is key to effective JIT tuning.
Introduction & Overview
Read summaries of the section's main ideas at different levels of detail.
Quick Overview
Standard
JIT Compiler Tuning emphasizes the importance of monitoring and improving JIT performance. By using the -XX:+PrintCompilation option, developers can view compiled methods and manually optimize hot methods that need attention.
Detailed
JIT Compiler Tuning
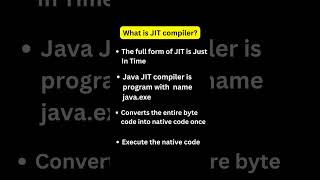
JIT (Just-In-Time) compiler tuning is crucial for optimizing the performance of Java applications running on the JVM. In Java, the JIT compiler translates bytecode into native machine code on-the-fly, which significantly accelerates performance, particularly for frequently executed code sections known as 'hot methods'. This section details the practical steps developers can take to tune the JIT compiler effectively.
Key Points:
-
Profiling Hot Methods: By enabling the JVM option
-XX:+PrintCompilation, developers can retrieve detailed information about methods that have been compiled at runtime. This visibility allows developers to analyze which methods are being executed most frequently and potentially require optimization. - Manual Tuning: Developers may need to intervene and manually optimize these hot methods based on the profiling data they collect. Manual tuning can include techniques such as method inlining, which simplifies method calls for speed, or refactoring code to reduce complexity in hot paths.
Overall, effective JIT Compiler Tuning is an iterative process involving monitoring, profiling, and tweaking code to enhance performance, ensuring the Java application runs smoothly and efficiently.
Youtube Videos


Audio Book
Dive deep into the subject with an immersive audiobook experience.
Viewing Compiled Methods
Chapter 1 of 2
🔒 Unlock Audio Chapter
Sign up and enroll to access the full audio experience
Chapter Content
- Use -XX:+PrintCompilation to view compiled methods.
Detailed Explanation
The first step in JIT compiler tuning involves using the JVM option '-XX:+PrintCompilation'. This option instructs the JVM to print detailed information to the console about methods that have been compiled by the JIT compiler. When a Java application runs, the JIT compiler optimizes frequently executed bytecode into native machine code for improved performance. By enabling this option, developers can identify which methods benefit from compilation and how well they are performing, helping them to focus their optimization efforts.
Examples & Analogies
Imagine you're a coach of a sports team, and you want to improve your players' performance. By reviewing the game footage, you can see which players are excelling in their roles and which might need extra practice. In the same way, '-XX:+PrintCompilation' allows developers to review which methods are being optimized, directing their focus toward the code that requires the most attention.
Profiling and Tuning Hot Methods
Chapter 2 of 2
🔒 Unlock Audio Chapter
Sign up and enroll to access the full audio experience
Chapter Content
- Profile and tune hot methods manually if needed.
Detailed Explanation
Following the identification of compiled methods, the next step is profiling and tuning the 'hot methods'. Hot methods are the parts of code that run the most frequently and can significantly impact application performance. By profiling these methods, developers can analyze where the bottlenecks occur and decide on specific optimizations. This might involve rewriting parts of the code, changing algorithmic approaches, or adjusting memory usage to improve efficiency. This hands-on approach requires a deep understanding of both the application code and the performance characteristics of the JVM.
Examples & Analogies
Consider a chef in a busy restaurant who notices that a specific dish takes too long to prepare. To improve efficiency, the chef experiments with different cooking techniques and prep methods until they find a faster process. Similarly, developers must analyze performance metrics of hot methods and fine-tune them to ensure the application runs smoothly and quickly, just like the chef aims to optimize dish preparation.
Key Concepts
-
JIT Compiler: Converts bytecode into native code during runtime for performance optimization.
-
Hot Methods: Types of methods that are invoked frequently, making them prime candidates for JIT compilation.
-
Profiling: A technique for collecting runtime data to identify which methods to optimize for better performance.
Examples & Applications
Enabling the -XX:+PrintCompilation flag in JVM options allows you to see compiled method outputs.
Refactoring a hot method to inline critical calculations instead of calling them enhances its speed.
Memory Aids
Interactive tools to help you remember key concepts
Rhymes
JIT compiles quick and neat, improving the code we write to beat the heat.
Stories
Imagine a chef who prepares meals. If he makes one dish repeatedly, he learns to make it faster—just like the JIT optimizing hot methods!
Memory Tools
Use the acronym 'HOT' to remember: 'H' for Hot methods, 'O' for Optimize, 'T' for Tune.
Acronyms
REMEMBER
JIT - Just Improvement Time for every method!
Flash Cards
Glossary
- JIT Compiler
A Just-In-Time compiler optimizes Java bytecode by translating it into native machine code at runtime for better performance.
- Hot Methods
Methods that are executed frequently and benefit the most from optimization by the JIT compiler.
- Profiling
The process of monitoring and analyzing the performance of code to identify hotspots needing optimization.
Reference links
Supplementary resources to enhance your learning experience.