JVM in Production
Enroll to start learning
You’ve not yet enrolled in this course. Please enroll for free to listen to audio lessons, classroom podcasts and take practice test.
Interactive Audio Lesson
Listen to a student-teacher conversation explaining the topic in a relatable way.
Benchmarking in Production
🔒 Unlock Audio Lesson
Sign up and enroll to listen to this audio lesson

Today, we’ll discuss benchmarking as it relates to JVM performance. Can anyone tell me why benchmarking is important?

It helps in understanding how changes affect performance?

Exactly, benchmarking helps in quantifying performance before and after tuning. It gives us concrete data to work with. We can remember this with the acronym B4AT—Benchmark Before Adjustments and Tuning.

So, what tools can we use for benchmarking?

Great question! Tools like JMH (Java Microbenchmark Harness) can be very effective. It allows testing small snippets of code to measure their performance accurately.

Are there any specific metrics we should focus on?

Yes! We should pay attention to memory usage, response times, and throughput. Remember, a good benchmark helps identify the bottlenecks and improve efficiency.

To recap, benchmarking is essential for verifying the impact of any changes we make to performance. Make sure to always benchmark B4AT!
Monitor with APM Tools
🔒 Unlock Audio Lesson
Sign up and enroll to listen to this audio lesson

Let’s talk about APM tools, which are fantastic for monitoring applications running on the JVM. Why do you think monitoring is crucial in production?

It helps us identify issues before they affect users?

Exactly! Monitoring allows us to be proactive. Tools like New Relic and Datadog can help visualize JVM metrics such as heap usage and GC times. You can remember these tools with the mnemonic 'Naughty Dogs Need Data'!

What should we be monitoring specifically?

We should monitor memory usage, thread counts, garbage collection performance, and response times. Consistently checking these metrics ensures we can react swiftly to any issues. Remember, 'MTGR' for Memory, Threads, Garbage, and Response!

In conclusion, APM tools are vital for keeping our JVM applications healthy. Monitoring should be an ongoing process.
Automated Alerts
🔒 Unlock Audio Lesson
Sign up and enroll to listen to this audio lesson

Our next topic is setting up automated alerts for critical JVM metrics. Why might automating alerts be beneficial?

It can notify us of problems immediately instead of waiting for user complaints!

Correct! By automating alerts for things like GC pauses or high heap usage, we can mitigate potential downtime. The mnemonic 'Gaps Cause Panic' can help us remember this!

What configurations should we focus on for these alerts?

Focusing on GC pause times and heap memory usage thresholds is essential. By setting repetitive alarms, we will always be aware of the JVM’s health.

To wrap up, automating alerts is essential to ensure timely actions on critical JVM metrics.
Introduction & Overview
Read summaries of the section's main ideas at different levels of detail.
Quick Overview
Standard
The section outlines critical best practices for deploying and managing JVM applications in production. It highlights the importance of benchmarking, utilizing container-specific configurations, and employing effective monitoring tools to ensure optimal performance and quick troubleshooting.
Detailed
JVM in Production
In production environments, the performance and reliability of applications running on the Java Virtual Machine (JVM) are of utmost importance. Effective management of JVM settings and application performance monitoring plays a crucial role in ensuring systems run smoothly and efficiently. In this section, we explore best practices that developers should adopt when deploying JVM applications in production.
Best Practices
- Benchmark Before/After Tuning: Understanding the impact of changes or tuning requires robust benchmarking. It is imperative to measure performance before and after adjustments to identify improvements or regressions.
- Container-specific Tuning for Kubernetes and Docker: Applications often run in containerized environments; hence, JVM configurations should take container memory limits into account. Adjusting the heap size and garbage collection (GC) settings according to available resources can lead to more efficient performance.
- Monitoring with APM Tools: Advanced Performance Monitoring (APM) tools such as New Relic, Datadog, and Prometheus + Grafana enable real-time monitoring of JVM performance metrics. This real-time feedback assists in identifying performance bottlenecks early in the lifecycle.
- Automate Alerts for GC Pauses and Heap Usage: Implement automated alert systems to notify developers or operations teams about GC pauses and heap usage thresholds. Proactive notifications can help prevent application downtimes due to memory issues.
Summary
Understanding and applying these best practices is essential for Java developers seeking to optimize performance and maintain the reliability of JVM applications in production. With the right tools and methodologies, developers can ensure enhanced performance and stability.
Youtube Videos


Audio Book
Dive deep into the subject with an immersive audiobook experience.
Benchmarking Before and After Tuning
Chapter 1 of 4
🔒 Unlock Audio Chapter
Sign up and enroll to access the full audio experience
Chapter Content
• Always benchmark before/after tuning.
Detailed Explanation
Benchmarking is the process of measuring the performance of a system before and after changes are made. This allows developers to understand the impact of their optimizations and ensures that the changes made lead to actual performance improvements. By capturing performance metrics, such as response time or throughput, developers can determine what works and what doesn’t.
Examples & Analogies
Imagine tuning a car's engine for better speed and efficiency. Before starting any modifications, you would measure its current performance (like speed and fuel efficiency). Once the modifications are complete, you would measure its performance again to see if your changes resulted in improvements. This is what benchmarking does for your software.
Container-Specific Tuning
Chapter 2 of 4
🔒 Unlock Audio Chapter
Sign up and enroll to access the full audio experience
Chapter Content
• Use container-specific tuning for Kubernetes, Docker.
Detailed Explanation
In modern application development, many applications run inside containers, which encapsulate the application and its environment. Tools such as Kubernetes and Docker manage these containers. Container-specific tuning refers to configuring the JVM settings to optimize performance within these environments. This includes managing memory limits, configuring CPU shares, and setting the right garbage collection parameters, all of which might differ from traditional JVM settings.
Examples & Analogies
Think of it like adjusting the settings on a dishwasher to optimize how well it cleans dishes in different scenarios. For example, you might set it differently for small loads versus large ones. Similarly, JVM settings should be tailored to match the specific constraints and characteristics of the container environment.
Monitoring with APM Tools
Chapter 3 of 4
🔒 Unlock Audio Chapter
Sign up and enroll to access the full audio experience
Chapter Content
• Monitor with APM tools (New Relic, Datadog, Prometheus + Grafana).
Detailed Explanation
Application Performance Management (APM) tools are essential for monitoring the performance of applications in production. They help developers track metrics such as response time, error rates, and system resource utilization (CPU, memory). This information is crucial for understanding how well an application performs in real-world scenarios and helps identify bottlenecks or issues that need to be addressed.
Examples & Analogies
Consider a health monitoring app that tracks vital signs like heart rate, temperature, and activity levels. Just like how a doctor uses this data to assess a patient's health, developers use APM tools to evaluate the 'health' of their applications. If the application starts showing slow response times, developers can investigate and take corrective action.
Automating Alerts for GC Pauses and Heap Usage
Chapter 4 of 4
🔒 Unlock Audio Chapter
Sign up and enroll to access the full audio experience
Chapter Content
• Automate alerts for GC pauses and heap usage.
Detailed Explanation
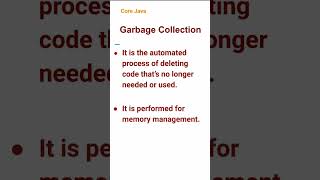
Garbage Collection (GC) is a process that frees up memory by removing objects that are no longer needed. However, prolonged GC pauses can impact application performance significantly. Automating alerts for GC pauses and monitoring heap usage helps developers stay informed about the memory consumption of their applications. By setting up alerts, developers can proactively address memory issues before they affect users.
Examples & Analogies
Think of a smoke detector in your home. It alerts you to potential fire hazards before they escalate into serious problems. Similarly, automating alerts for garbage collection ensures that developers are notified about memory issues before they lead to application slowdowns or crashes.
Key Concepts
-
Benchmarking: Measurement of performance before and after tuning to assess impacts.
-
APM Tools: Tools used to monitor and manage application performance metrics.
-
GC Pauses: Mandatory delays during garbage collection that can temporarily halt application processing.
-
Heap Usage: The amount of memory currently occupied by allocated objects in the JVM heap.
Examples & Applications
Using JMH for benchmarking your Java methods to identify which methods need optimization.
Setting up New Relic in a Java application to continuously monitor and analyze performance metrics.
Memory Aids
Interactive tools to help you remember key concepts
Rhymes
When JVM is in strife, use alerts to save life!
Stories
Imagine a diligent developer named Jazy who meticulously benchmarks her application. Each time she makes a change, she measures if performance improves. After some tuning, Jazy receives an alert about a GC pause that she quickly resolves, preventing a meltdown!
Memory Tools
Remember 'B4AT' - Benchmark Before Adjustments and Tuning.
Acronyms
Use 'MTGR' to recall Memory, Threads, Garbage, and Response metrics for monitoring.
Flash Cards
Glossary
- Benchmarking
The process of measuring the performance of a system before and after making changes to assess the impact.
- APM Tools
Application Performance Monitoring tools used to monitor and manage performance metrics in production environments.
- GC Pause
The time taken during garbage collection when application threads are paused to reclaim memory.
- Heap Usage
The amount of memory currently utilized by the application's heap on the JVM.
Reference links
Supplementary resources to enhance your learning experience.
