JVM Internals and Performance Tuning
Enroll to start learning
You’ve not yet enrolled in this course. Please enroll for free to listen to audio lessons, classroom podcasts and take practice test.
Interactive Audio Lesson
Listen to a student-teacher conversation explaining the topic in a relatable way.
JVM Architecture Overview
🔒 Unlock Audio Lesson
Sign up and enroll to listen to this audio lesson

Today, we'll explore the architecture of the JVM. It provides a foundational understanding of how Java operates across different platforms with its 'write once, run anywhere' capability. Can anyone tell me what the key components of the JVM architecture are?

Is the Garbage Collector one of those components?

Exactly! The Garbage Collector is crucial for memory management. It's one of several key components, including the Class Loader, Execution Engine, and Runtime Data Areas. Each plays a vital role. Who can summarize what the Class Loader does?

The Class Loader is responsible for loading classes into memory, right?

That's correct! It even has different types like the Bootstrap ClassLoader. Remember, our acronym 'CLEG' can stand for Class Loader, Execution Engine, Runtime Data Areas, and Garbage Collector.

What happens during the loading process?

Great question! The loading process involves Reading 'class' files, then Linking them, followed by Initialization. Anyone remembers what these linking steps are composed of?

Verification, Preparation, and Resolution!

Perfect! Well done! In summary, the JVM architecture consists of many interacting components, all crucial for executing Java applications efficiently.
Garbage Collection (GC)
🔒 Unlock Audio Lesson
Sign up and enroll to listen to this audio lesson

Now, let's dive into Garbage Collection or GC. Can someone explain why GC is essential in Java?

I think it's to manage memory automatically and free up space when it's no longer needed.

Correct! GC helps avoid memory leaks by reclaiming memory used by objects that are no longer referenced. What are the main generations in Garbage Collection?

There’s the Young Generation and the Old Generation.

Right! The Young Generation handles new objects and is where most objects die young, while the Old Generation stores long-lived objects. How about GC algorithms? Any examples?

There’s the G1 Garbage Collector and CMS, right?

Exactly! The G1 GC is known for its efficiency in splitting the heap into regions for optimal collection. Remember to think back to the phrase 'Mark, Sweep, Compact' to summarize the GC process!

So, GC helps to prevent performance degradation over time?

Absolutely! In summary, Garbage Collection is a dynamic memory management process that is critical for Java applications, significantly affecting performance.
JVM Tuning Techniques
🔒 Unlock Audio Lesson
Sign up and enroll to listen to this audio lesson

Let’s shift our focus to JVM tuning techniques. Why do you think it's important to tune the JVM?

To optimize performance and manage memory better, I guess?

Exactly! A well-tuned JVM can drastically improve application speed. What are some common tuning flags you would use?

I recall '-Xmx' for max heap and '-Xms' for initial heap size.

Exactly right! And adjusting the Eden/Survivor ratio with '-XX:SurvivorRatio' is crucial too. Has anyone tried profiling methods for JIT compilation?

Yes! Using '-XX:+PrintCompilation' can show which methods get compiled.

Spot on! Remember, optimizing the JVM involves both memory settings and execution strategies. Always remember the principle: 'Tuning is a balance—measure, change, measure!'

So continuous monitoring and adjustment are key?

Absolutely! In summary, JVM tuning fuses memory and performance management and is essential for maintaining efficient Java applications.
Common JVM Pitfalls
🔒 Unlock Audio Lesson
Sign up and enroll to listen to this audio lesson

To wrap up our discussions, how about discussing common JVM pitfalls? What is one example of a pitfall you can think of?

I think memory leaks due to holding references can be a big issue.

Correct! Even with Garbage Collection, holding onto references can cause problems. What about errors like OutOfMemoryError?

There are different types, like heap space and GC overhead limit.

Yes! Each type comes with distinct implications. Remember that StackOverflowError often results from excessive recursive calls. To avoid these pitfalls, it's crucial to refactor code and understand JVM limitations.

So, proactive coding and monitoring can help mitigate these risks?

Exactly! Regular monitoring of heap usage and alerting for GC pauses is wise. In summary, being aware of common pitfalls allows developers to ensure robust and performant Java applications.
Introduction & Overview
Read summaries of the section's main ideas at different levels of detail.
Quick Overview
Standard
Understanding the JVM's architecture is crucial for advanced Java developers as it involves components like the Class Loader, Execution Engine, and Garbage Collector. Additionally, effective performance tuning can significantly improve application efficiency and resource management.
Detailed
Detailed Summary
The Java Virtual Machine (JVM) is foundational to Java’s cross-platform capabilities, translating bytecode into executable actions, which involves crucial components like:
- Class Loader Subsystem: Responsible for loading Java classes dynamically, comprising different loaders such as Bootstrap, Extension, and Application ClassLoaders.
- Runtime Data Areas: These include the Method Area for storing metadata and method data, the Heap for objects, and stacks for method execution.
- Execution Engine: This encompasses the Interpreter, which executes bytecode, and the Just-In-Time (JIT) compiler, which converts bytecode to native machine code for performance gains using techniques such as method inlining and escape analysis.
- Garbage Collector (GC): Automates memory management through allocated and de-allocated memory in generations, employing various algorithms (like G1 and ZGC) to optimize performance and memory usage.
Incorporating JVM tuning techniques can lead to substantial application performance improvements through heap and JIT compiler tuning, while being aware of common pitfalls like memory leaks is crucial. This in-depth knowledge enables developers to write efficient Java applications, diagnose performance issues, and efficiently manage resources.
Youtube Videos






Audio Book
Dive deep into the subject with an immersive audiobook experience.
Introduction to JVM
Chapter 1 of 10
🔒 Unlock Audio Chapter
Sign up and enroll to access the full audio experience
Chapter Content
The Java Virtual Machine (JVM) is the cornerstone of the Java platform. It enables the "write once, run anywhere" capability by abstracting the underlying hardware and operating system. Understanding the internals of the JVM is essential for advanced Java developers, especially for those aiming to optimize performance, troubleshoot complex issues, or work on enterprise-scale systems. This chapter delves deep into the structure, components, and functioning of the JVM, and then transitions into advanced performance tuning techniques.
Detailed Explanation
The JVM is a vital part of the Java ecosystem, allowing Java programs to run on any device or operating system without needing changes to the code. This feature is known as "write once, run anywhere." For developers, knowing how the JVM operates is crucial, especially when it comes to improving the performance of applications, diagnosing issues, or managing large-scale systems. This chapter will cover the main elements of the JVM's structure, followed by advanced methods for tuning performance, which will help developers leverage the JVM's capabilities more effectively.
Examples & Analogies
Think of the JVM like a universal remote control that can operate any TV brand in your house. Just as the remote abstracts away the complexities of different TV systems, allowing you to change channels and adjust volume without understanding each TV’s design, the JVM lets Java code run on any machine without needing to modify it for different operating systems or hardware.
JVM Architecture Overview
Chapter 2 of 10
🔒 Unlock Audio Chapter
Sign up and enroll to access the full audio experience
Chapter Content
The JVM is a specification, not a concrete implementation. It defines the abstract machine that interprets Java bytecode. Oracle’s HotSpot JVM is the most widely used implementation.
Detailed Explanation
The JVM itself is essentially a set of guidelines or specifications that detail how Java programs should be executed. However, there are several specific implementations of these guidelines, with Oracle's HotSpot JVM being the most widely adopted. This means that although the JVM defines how Java should run, the actual running of the code is done by a specific version of the JVM that follows these guidelines.
Examples & Analogies
Imagine a blueprint for a house. The blueprint details how the house should be constructed but doesn't represent an actual house. Different builders may use the blueprints to construct houses using different materials or techniques, just like various companies can build their Java Virtual Machines according to the JVM specifications.
Key Components of JVM
Chapter 3 of 10
🔒 Unlock Audio Chapter
Sign up and enroll to access the full audio experience
Chapter Content
- Class Loader Subsystem
- Runtime Data Areas
- Execution Engine
- Native Interface
- Garbage Collector
Detailed Explanation
The JVM has several key components that work together to execute Java applications effectively. The Class Loader Subsystem is responsible for loading classes, the Runtime Data Areas store data used during execution, the Execution Engine runs the bytecode, the Native Interface allows Java to call functions from other languages, and the Garbage Collector automatically manages memory to avoid memory leaks.
Examples & Analogies
Think of a theater where a play is being performed. The Class Loader is the person who brings in actors (classes) to the stage (memory). The Runtime Data Areas are like the props and scripts that help the actors perform. The Execution Engine is the stage manager who directs the actors on what to do, the Native Interface allows props from other plays to be used, and the Garbage Collector is like the cleanup crew, ensuring the stage is tidy between acts.
Class Loader Subsystem
Chapter 4 of 10
🔒 Unlock Audio Chapter
Sign up and enroll to access the full audio experience
Chapter Content
Responsible for loading classes into memory.
Detailed Explanation
The Class Loader Subsystem plays a critical role in the JVM by loading classes into memory as they are needed. This is a dynamic process, meaning that classes are loaded only when they are required during the execution of the program. This efficiency helps in managing system resources effectively.
Examples & Analogies
Imagine a library where you only pull out the books you need for your current assignment rather than taking all the books out at once. The Class Loader works similarly, pulling in only the classes (books) that are necessary for the program (assignment) to run.
Types of Class Loaders
Chapter 5 of 10
🔒 Unlock Audio Chapter
Sign up and enroll to access the full audio experience
Chapter Content
- Bootstrap ClassLoader Loads core Java classes from rt.jar or modules like java.base.
- Extension ClassLoader Loads classes from ext directory (lib/ext).
- Application ClassLoader Loads classes from the classpath.
Detailed Explanation
There are three main types of Class Loaders within the JVM. The Bootstrap ClassLoader loads essential Java classes from core libraries, ensuring that the fundamental elements of the Java language are available. The Extension ClassLoader loads classes from the Java extension directories, while the Application ClassLoader is responsible for loading application classes that are part of the classpath set by the user.
Examples & Analogies
Think of three different shelves in a kitchen: the top shelf has essential cooking tools (Bootstrap ClassLoader), the middle shelf has extra tools that might not be used every day (Extension ClassLoader), and the bottom shelf has tools used specifically for certain recipes (Application ClassLoader). Each shelf serves a specific purpose to make cooking (running Java programs) easier and more efficient.
Loading Process of Classes
Chapter 6 of 10
🔒 Unlock Audio Chapter
Sign up and enroll to access the full audio experience
Chapter Content
- Loading: Reads .class files into memory.
- Linking:
- Verification
- Preparation
- Resolution
- Initialization: Execution of static blocks.
Detailed Explanation
The loading process of classes in the JVM involves several steps. First, the class files, which are compiled Java code, are read into memory. Next, linking occurs, which includes verification (checking if the class files are structurally correct), preparation (allocating memory for static variables), and resolution (resolving symbolic references to actual memory addresses). Finally, initialization executes any static code blocks, setting up the class for use.
Examples & Analogies
Imagine preparing a recipe. First, you gather all the ingredients (Loading), then you check if they are good (Verification), measure them out (Preparation), and ensure you have everything you need for the dish (Resolution). Finally, you start cooking (Initialization), putting everything together.
JVM Runtime Data Areas
Chapter 7 of 10
🔒 Unlock Audio Chapter
Sign up and enroll to access the full audio experience
Chapter Content
28.3.1 Method Area (MetaSpace in HotSpot)
Stores class structure like metadata, method data, and constants.
28.3.2 Heap
- Stores all objects and class instances.
- Divided into:
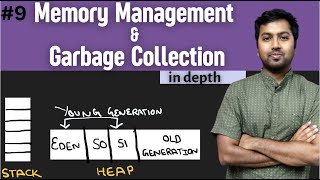
- Young Generation (Eden + Survivor Spaces)
- Old Generation (Tenured Space)
28.3.3 Java Stack
- Contains stack frames.
- Each frame holds local variables, operand stack, and return address.
28.3.4 PC Register
- Holds the address of the current instruction being executed.
28.3.5 Native Method Stack
- Stores information for native (non-Java) methods.
Detailed Explanation
The JVM has specific areas of memory dedicated to different tasks. The Method Area, or MetaSpace in newer implementations, contains metadata about classes, including information needed to create objects. The Heap is where all objects and instances of classes are stored, and it's divided into generations: the Young Generation, which holds newly created objects, and the Old Generation where objects that have survived multiple garbage collection cycles reside. The Java Stack keeps track of method calls and local variables in stack frames. The PC Register is a small area that tracks the current instruction being executed, and the Native Method Stack holds information for methods that are written in languages other than Java.
Examples & Analogies
Consider a library (JVM) with various sections. The Method Area is like the catalog that keeps track of all the books (classes) and their details. The Heap is the shelves where all the books (objects) are stored, divided by old and new titles. The Java Stack is like the librarian’s desk recording which books are currently being checked out (method calls), while the PC Register acts as a bookmark showing the page you’re on. Finally, the Native Method Stack can be likened to a special section where non-fiction or rare books (native methods) are stored.
Execution Engine
Chapter 8 of 10
🔒 Unlock Audio Chapter
Sign up and enroll to access the full audio experience
Chapter Content
Responsible for executing bytecode.
Detailed Explanation
The Execution Engine is the part of the JVM that takes the Java bytecode and executes it. It does this either through an interpreter, which executes the bytecode line-by-line, or through a Just-In-Time (JIT) Compiler, which translates chunks of bytecode into native machine code for quicker execution.
Examples & Analogies
Imagine a chef (Execution Engine) who has a recipe written in a language he can translate. He might read through it line by line (interpreter), making the dish step by step. Alternatively, he can memorize the whole recipe and cook it fast (JIT), which saves time and enhances efficiency.
Garbage Collection (GC)
Chapter 9 of 10
🔒 Unlock Audio Chapter
Sign up and enroll to access the full audio experience
Chapter Content
Automatic memory management in Java.
Detailed Explanation
Garbage Collection in Java helps manage memory automatically by freeing up space that is no longer in use. This allows programmers to focus on their code without having to manually clean up unreferenced objects, reducing the risk of memory leaks and improving application performance.
Examples & Analogies
Think of a bustling cafe where customers leave tables dirty (unused objects). The staff (Garbage Collector) comes by and cleans up (frees memory) so that new customers can sit and enjoy their experience. Because the staff works consistently, the cafe remains clean and efficient, just as a well-functioning Java application benefits from effective GC.
JVM Tuning Techniques
Chapter 10 of 10
🔒 Unlock Audio Chapter
Sign up and enroll to access the full audio experience
Chapter Content
28.7.1 Heap Tuning
- Use -Xms and -Xmx to set initial and max heap.
- Tune Eden/Survivor ratio with -XX:SurvivorRatio.
28.7.2 GC Tuning
- Choose the right GC (Serial, G1, ZGC, etc.)
- Use -XX:+PrintGCDetails and analyze logs.
- Tune thresholds using:
- -XX:MaxGCPauseMillis
- -XX:G1HeapRegionSize
28.7.3 JIT Compiler Tuning
- Use -XX:+PrintCompilation to view compiled methods.
- Profile and tune hot methods manually if needed.
Detailed Explanation
Tuning the JVM can significantly enhance the performance of Java applications. Key techniques include managing heap size with flags -Xms and -Xmx to ensure sufficient memory and adjusting the Eden and Survivor ratio to optimize garbage collection. Additionally, selecting the appropriate garbage collector based on application needs can minimize pause times and maximize throughput. Finally, JIT compiler tuning can be achieved by monitoring which methods are compiled and adjusting those that frequently run to improve execution speed.
Examples & Analogies
Consider tuning a sports car for better performance. Adjusting the tire pressure (heap size) ensures proper traction, while modifying the engine's fuel mixture (Eden/Suvivor ratio) maximizes efficiency. Choosing the right fuel type (garbage collector) and regularly checking engine diagnostics (performance monitoring) help maintain optimal performance, similar to how JVM tuning can elevate your Java application's efficiency.
Key Concepts
-
JVM Architecture: The structure of the JVM that includes the Class Loader, Runtime Data Areas, Execution Engine, and Garbage Collector.
-
Garbage Collection: A process that automatically manages memory by reclaiming memory used by objects that are no longer reachable.
-
JIT Compilation: The process of converting bytecode into native code to enhance performance.
-
Memory Management: Techniques that ensure efficient use of memory through garbage collection and tuning.
-
Pitfalls: Common issues developers face in JVM such as memory leaks, OutOfMemoryError, and StackOverflowError.
Examples & Applications
In a typical Java application, the JVM uses a Class Loader to load classes from the classpath into memory at runtime, managing access permissions.
When an object is no longer referenced, the Garbage Collector automatically reclaims its memory, demonstrating Java's auto-memory management capabilities.
Memory Aids
Interactive tools to help you remember key concepts
Rhymes
In the JVM, things go right, classes load, and memory's tight. Garbage cleaned from old and new, keeps our Java applications true.
Stories
Imagine JVM as a diligent gardener, constantly tending to two plots of land: one with new sprouting plants (Young Generation) and the other with established trees (Old Generation). When plants wilt and wither, the gardener gently removes them, making room for new growth, just like the GC does with memory.
Memory Tools
JIT: 'Just In Time' - think of making a timely dish—compiling just before it gets served!
Acronyms
Remember 'CLASS' for JVM components
Class Loader
Runtime Data Areas
Execution Engine
Garbage Collector
Stack.
Flash Cards
Glossary
- Class Loader
The subsystem responsible for loading classes into memory in the JVM.
- Garbage Collector (GC)
An automatic memory management system that reclaims memory used by objects that are no longer referenced.
- Heap
A runtime data area from which memory for all class instances and arrays is allocated.
- JIT Compiler
Just-In-Time compiler that compiles bytecode into native machine code for faster execution.
- OutOfMemoryError
An error that occurs when the JVM cannot allocate an object because it is out of memory.
- MetaSpace
The memory space allocated for class metadata starting in Java 8, replacing the Permanent Generation.
- Young Generation
The part of the heap that holds newly created objects.
- Old Generation
The part of the heap that stores long-lived objects.
Reference links
Supplementary resources to enhance your learning experience.
