
Deriving a Demand Curve from Indifference Curves and Budget Constraints
Enroll to start learning
You’ve not yet enrolled in this course. Please enroll for free to listen to audio lessons, classroom podcasts and take practice test.
Interactive Audio Lesson
Listen to a student-teacher conversation explaining the topic in a relatable way.
Understanding Consumer Equilibrium
🔒 Unlock Audio Lesson
Sign up and enroll to listen to this audio lesson

Welcome, everyone! Today we’re going to discuss consumer equilibrium in the context of demand curves. Can someone tell me what we mean by consumer equilibrium?

Is it when a consumer maximizes their utility given their budget?
Exactly! The consumer achieves equilibrium by choosing a combination of goods that maximizes satisfaction within their budget constraints. For example, when purchasing bananas and mangoes, if the price changes, how do you think that impacts their choice?

I think if bananas get cheaper, they would buy more bananas.
Correct! This leads to the substitution effect. If bananas' price drops, they substitute bananas for mangoes, staying on a higher indifference curve. Let’s remember this with the acronym 'BIS' — where B is for Budget, I is for Indifference, and S is for Substitution. Can anyone think of an example of this in real life?

Like when the price of apples goes down, people buy more apples instead of oranges!
Great example! So remember, as price decreases, quantity demanded increases, confirming the law of demand. Any questions on this?
Indifference Curves Explained
🔒 Unlock Audio Lesson
Sign up and enroll to listen to this audio lesson

Now let's discuss indifference curves more thoroughly. Can anyone explain what they represent?
They show combinations of goods that give the consumer the same level of satisfaction, right?
Right! And they slope downwards, meaning if you want more of one good, you have to give up some of the other. This is where we can use the mnemonic 'DOWN' — it reminds us 'Diminishing returns of Utility on the Way to new satisfaction.'
What if they are perfectly substitutable? Would they still slope downwards?
Good question! If the goods are perfect substitutes, the indifference curve is a straight line, indicating a constant rate of substitution. Remember this! Any further questions on indifference curves?
Impact of Price on Demand Curves
🔒 Unlock Audio Lesson
Sign up and enroll to listen to this audio lesson
Let's examine how a drop in the price of bananas impacts the demand curve. What happens to the budget line?
It expands, allowing the consumer to buy more bananas.
Exactly! As the consumer can afford more, there's a movement along the demand curve leading to higher quantity demanded. Remember the simple phrase 'Price Down, Demand Up!' What do you all think about the effects of income on this?

If the price of bananas drops, then the purchasing power increases too!
Spot on! That’s the income effect. So a price drop leads to both substitution and income effects driving the demand up. Does everyone understand the interplay of these effects?
Law of Demand Recap
🔒 Unlock Audio Lesson
Sign up and enroll to listen to this audio lesson
As we wrap up, let’s review the law of demand. Who can remind me what it states?
When the price of a good increases, the quantity demanded decreases, and vice versa.
Exactly! It’s a fundamental concept in economics. So, if you see a downward sloping demand curve, you know it reflects the law of demand. Who can tie this back to our earlier concepts?
It relates back to how indifference curves and budget constraints demonstrate how consumers react to price changes!
Right again! Remember, this all ties together in understanding consumer behavior. Any final thoughts or questions?
Introduction & Overview
Read summaries of the section's main ideas at different levels of detail.
Quick Overview
Standard
The section delves into the derivation of the demand curve using indifference curves and budget constraints, illustrating how changes in the price of a good can influence consumer choices. It discusses the substitution and income effects that occur when the price of a commodity changes, resulting in a negatively sloped demand curve.
Detailed
Deriving a Demand Curve from Indifference Curves and Budget Constraints
In this section, we explore the concept of how a demand curve can be derived from indifference curves and the consumer's budget constraints. The relationship between these elements is crucial for understanding consumer behavior in economic theory.
Key Points:
- Consumer Equilibrium: At equilibrium, a consumer will choose a combination of goods (bananas and mangoes in this case) that maximizes utility while remaining within budget constraints.
- Indifference Curves: These curves represent combinations of goods that provide the same level of satisfaction to the consumer. As the price of one good changes, it affects the consumption equilibrium, leading to a shift to a higher indifference curve.
- Budget Constraints: The budget line represents all combinations of goods that the consumer can afford at given prices. Changes in prices or income alter this line, impacting the consumer's choice.
- Price Changes: When the price of bananas drops, the budget set expands, leading consumers to afford higher quantities of bananas, resulting in movements along the demand curve.
- Substitution and Income Effects: The demand curve is negatively sloped due to these effects — as bananas become cheaper, consumers will substitute bananas for mangoes (substitution effect), and the consumer’s purchasing power increases, leading to increased demand for both goods (income effect).
- Law of Demand: Reiterates that, ceteris paribus, a decrease in the price of a commodity leads to an increase in the quantity demanded.
Understanding these concepts is vital for analyzing consumer choice behavior and demand relationships in economics.
Youtube Videos


Audio Book
Dive deep into the subject with an immersive audiobook experience.
Consumer Behavior and Consumption Equilibrium
Chapter 1 of 5
🔒 Unlock Audio Chapter
Sign up and enroll to access the full audio experience
Chapter Content
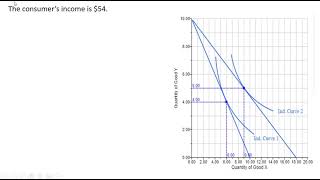
Consider an individual consuming bananas (X1) and mangoes (X2), whose income is M and market prices of X1 and X2 are P1 and P2 respectively. Figure (a) depicts her consumption equilibrium at point C, where she buys X1 and X2 quantities of bananas and mangoes respectively. In panel (b) of figure 2.14, we plot P1 against X1 which is the first point on the demand curve for X1.
Detailed Explanation
This portion introduces the scenario of an individual consumer making choices between two goods: bananas and mangoes. The point C on the graph represents where the consumer maximizes her satisfaction (utility) based on her budget and the prices of the goods. The quantities of each good purchased at this equilibrium are referred to as X1 for bananas and X2 for mangoes. This sets the framework for understanding how demand for bananas is influenced by price.
Examples & Analogies
Imagine someone trying to budget their monthly grocery shopping. If they have a fixed income (M), they have to decide how many bananas and mangoes they can buy without exceeding their budget. The point C is like finding that perfect balance where they get maximum satisfaction from their groceries.
Effects of Price Change on Demand
Chapter 2 of 5
🔒 Unlock Audio Chapter
Sign up and enroll to access the full audio experience
Chapter Content
Suppose the price of X1 drops to P1 with P2 and M remaining constant. The budget set in panel (a) expands and new consumption equilibrium is on a higher indifference curve at point D, where she buys more of bananas (X1 > X1*). Thus, demand for bananas increases as its price drops.
Detailed Explanation
Here, we see the effect of a price change on demand. When the price of bananas (X1) drops, the consumer can afford more bananas while still having the same budget, allowing her to reach a new equilibrium at point D on a higher indifference curve. This signifies that the quantity of bananas demanded increases as the price decreases, demonstrating the law of demand.
Examples & Analogies
Think of a sale at your favorite grocery store. If bananas were originally $1 each and suddenly go on sale for $0.50, you'd likely buy more bananas than before, as you can get more for your money. This shows how a drop in price can lead to an increase in demand.
Understanding the Demand Curve
Chapter 3 of 5
🔒 Unlock Audio Chapter
Sign up and enroll to access the full audio experience
Chapter Content
Likewise, the price of bananas can be dropped further to P1, resulting in further increase in consumption of bananas to X1. P1 plotted against X1 gives us the third point on the demand curve. Therefore, we observe that a drop in price of bananas results in an increase in quantity of bananas purchased by an individual who maximizes his utility.
Detailed Explanation
Continuing from the previous point, if the price of bananas decreases further to a new point P1, the consumer buys even more bananas (X1). Plotting this point also on the demand graph allows us to visualize how the demand curve shifts downward to the right, confirming that lower prices lead to higher demand. This showcases the consistent negative slope of demand curves.
Examples & Analogies
Imagine a situation where a new vendor starts selling bananas for even less than before. Just like a consumer might buy more bananas at $0.50 rather than $1.00, if they find them for $0.25, they would likely buy even more, representing an expansion of demand.
Explaining Demand through Economic Effects
Chapter 4 of 5
🔒 Unlock Audio Chapter
Sign up and enroll to access the full audio experience
Chapter Content
The negative slope of the demand curve can also be explained in terms of the two effects, namely, substitution effect and income effect that come into play when the price of a commodity changes.
Detailed Explanation
When the price of bananas decreases, two main effects come into play that influence demand: the substitution effect and the income effect. The substitution effect occurs as consumers switch from more expensive goods (like mangoes) to cheaper ones (bananas). The income effect arises because lower prices effectively increase the consumer’s purchasing power, allowing them to buy more of both goods.
Examples & Analogies
Think about how, if bananas get cheaper and you also have some extra money to spend, you might buy more bananas instead of mangoes (substitution effect) and still have some cash left for extra snacks or treats (income effect). This combination explains why you choose to buy more bananas.
Law of Demand Overview
Chapter 5 of 5
🔒 Unlock Audio Chapter
Sign up and enroll to access the full audio experience
Chapter Content
Law of Demand: Law of Demand states that other things being equal, there is a negative relation between demand for a commodity and its price. In other words, when price of the commodity increases, demand for it falls and when price of the commodity decreases, demand for it rises, other factors remaining the same.
Detailed Explanation
The Law of Demand illustrates the fundamental principle in economics that, with all other factors held constant, there is an inverse relationship between price and quantity demanded. This means that as prices rise, consumers tend to buy less of a good, while lower prices tend to spur an increase in purchasing.
Examples & Analogies
Imagine a simple scenario: if the price of a concert ticket goes up significantly, fewer people are likely to buy those tickets. Conversely, if the tickets become much cheaper, more people will likely decide to go to the concert. This simple rule exemplifies the Law of Demand.
Key Concepts
-
Consumer Equilibrium: Maximization of utility given budget.
-
Indifference Curves: Represent equal satisfaction combinations.
-
Budget Constraint: Depicts affordable combinations of goods.
-
Substitution Effect: Change in demand due to relative price changes.
-
Income Effect: Change in demand due to purchasing power shifts.
-
Law of Demand: Inverse relationship between price and quantity demanded.
Examples & Applications
If the price of bananas drops, consumers will buy more bananas while purchasing fewer mangoes.
The substitution effect explains why people might switch from brands when prices change.
Memory Aids
Interactive tools to help you remember key concepts
Rhymes
When prices fall, demand will rise, a consumer's joy cannot disguise.
Stories
Imagine a shopper at a market. When bananas go on sale, she quickly buys more and calls her friend to share. This joyful moment illustrates how price changes affect her choices.
Memory Tools
BIS: Budget, Indifference, Substitution to remember how prices and choices interact.
Acronyms
DICE - Demand Increases when Cost Eradicated (price drops).
Flash Cards
Glossary
- Consumer Equilibrium
The point where a consumer maximizes their utility given their budget constraints.
- Indifference Curve
A graph that depicts combinations of two goods that provide equal satisfaction and utility to a consumer.
- Budget Constraint
An equation that represents the combinations of goods a consumer can purchase given their income and the prices of the goods.
- Substitution Effect
The change in quantity demanded of a good due to a change in its price relative to other goods.
- Income Effect
The change in quantity demanded of a good resulting from a change in a consumer’s purchasing power.
- Law of Demand
There is an inverse relationship between price and quantity demanded, everything else being constant.
Reference links
Supplementary resources to enhance your learning experience.