
Indifference Map
Enroll to start learning
You’ve not yet enrolled in this course. Please enroll for free to listen to audio lessons, classroom podcasts and take practice test.
Interactive Audio Lesson
Listen to a student-teacher conversation explaining the topic in a relatable way.
Understanding Indifference Curves
🔒 Unlock Audio Lesson
Sign up and enroll to listen to this audio lesson

Today, we're going to explore Indifference Curves, which visually represent how consumers make choices between two different goods. Can anyone tell me what they think an indifference curve represents?

Is it the combinations of goods that give the same satisfaction?
Exactly! Each point on the curve represents a combination of goods, such as bananas and mangoes, that provide equal satisfaction to the consumer. Now, can someone explain why these curves slope downwards?

Because if a consumer wants more of one good, they must give up some of the other good to maintain the same satisfaction level.
Right! This demonstrates the Law of Diminishing Marginal Rate of Substitution. To remember this, think of 'more for less'—you gain more of one good but have to give up some of another. Let’s review this concept further.
Features of Indifference Curves
🔒 Unlock Audio Lesson
Sign up and enroll to listen to this audio lesson

Let's dive deeper into the features of indifference curves. What are some characteristics you would expect to see?

They never intersect, right? If they did, it would mean the same combination of goods gives different satisfaction levels.
Exactly, great observation! Indifference curves cannot intersect because that would imply contradictory preferences. Can anyone think of another reason why higher curves represent higher utility?

Because as we move to higher curves, we have more of at least one good?
Yes! Higher curves indicate more goods, which generally increases utility. To summarize, higher indifference curves represent better overall satisfaction. Remember this: 'Higher slopes, Higher happiness!'
Marginal Rate of Substitution
🔒 Unlock Audio Lesson
Sign up and enroll to listen to this audio lesson
Next, let’s talk about the Marginal Rate of Substitution, or MRS. Who can explain what this means?
Is it the rate at which a consumer is willing to give up one good for another without changing their satisfaction?
Correct! The MRS decreases as you consume more of one good and less of another. Can anyone think of an example?
If I have a lot of bananas, I will only give up a few mangoes for a banana, but if I have few bananas, I'd give up more mangoes for one banana.
Exactly! This reflects the diminishing rate of substitution. Let’s use the acronym 'MRS'—More Reducing Satisfaction—to remember this concept.
Using Indifference Maps for Consumer Behavior
🔒 Unlock Audio Lesson
Sign up and enroll to listen to this audio lesson
Now, let’s apply these concepts to consumer behavior. How do indifference maps help us understand choices given a budget?
They show us preferences, and we can plot these curves against budget constraints to find optimal consumption points.
Spot on! The optimal choice occurs where the budget line is tangent to an indifference curve, revealing maximum satisfaction. Can someone summarize what would happen if income increased?
If income increases, the budget line shifts outward, allowing more combinations of goods to be consumed, which would typically be at a higher indifference curve.
Exactly! 'More Money Means More Choices!' is a great way to remember that. Great discussions today!
Introduction & Overview
Read summaries of the section's main ideas at different levels of detail.
Quick Overview
Standard
An Indifference Map displays a range of indifference curves, illustrating the various combinations of two goods among which a consumer is indifferent. Each curve reflects different utility levels, and the shape of these curves demonstrates the trade-offs consumers are willing to make between goods while maintaining constant satisfaction.
Detailed
In the study of consumer behavior, the Indifference Map is a significant tool that illustrates a consumer's preferences among different consumption bundles. It consists of a family of indifference curves, each representing all combinations of two goods (e.g., bananas and mangoes) that yield the same level of satisfaction or utility to the consumer. The downward slope of these curves indicates that an increase in the consumption of one good necessitates a decrease in the other to maintain the same utility level, which is a direct application of the Law of Diminishing Marginal Rate of Substitution (MRS). This concept reflects how the consumer values the trade-off between the two goods. Indifference maps are essential for visualizing consumer choices, analyzing behavior based on budget constraints, and deriving demand curves, hence allowing for the understanding of how shifts in income or prices impact consumption patterns.
Youtube Videos


Audio Book
Dive deep into the subject with an immersive audiobook experience.
Introduction to Indifference Maps
Chapter 1 of 2
🔒 Unlock Audio Chapter
Sign up and enroll to access the full audio experience
Chapter Content
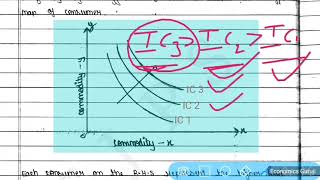
The consumer’s preferences over all the bundles can be represented by a family of indifference curves as shown in Figure 2.5. This is called an indifference map of the consumer. All points on an indifference curve represent bundles which are considered indifferent by the consumer. Monotonicity of preferences imply that between any two indifference curves, the bundles on the one which lies above are preferred to the bundles on the one which lies below.
Detailed Explanation
An indifference map illustrates a consumer's preferences by displaying multiple indifference curves. Each curve consists of points representing different combinations of two goods that provide the same level of satisfaction to the consumer. If one curve lies above another, it indicates a higher level of satisfaction. Therefore, a consumer prefers any bundles on a higher indifference curve compared to a lower one, due to the principle of monotonicity which implies that more is always better, assuming no loss in quantity of the other good.
Examples & Analogies
Imagine a student who enjoys both pizza and pasta. The indifference map reflects their preferences for various combinations of these foods. For example, if the student has a higher curve with more pizza without sacrificing pasta, they prefer this combination over a lower curve where they have less pizza and pasta. This analogy helps in understanding how consumers rank their preferences.
Features of Indifference Curves
Chapter 2 of 2
🔒 Unlock Audio Chapter
Sign up and enroll to access the full audio experience
Chapter Content
- Indifference curve slopes downwards from left to right: An indifference curve slopes downwards from left to right, which means that in order to have more of bananas, the consumer has to forego some mangoes. If the consumer does not forego some mangoes with an increase in number of bananas, it will mean consumer having more of bananas with same number of mangoes, taking her to a higher indifference curve. Thus, as long as the consumer is on the same indifference curve, an increase in bananas must be compensated by a fall in quantity of mangoes.
- Higher indifference curve gives greater level of utility: As long as marginal utility of a commodity is positive, an individual will always prefer more of that commodity, as more of the commodity will increase the level of satisfaction.
- Two indifference curves never intersect each other: Two indifference curves intersecting each other will lead to conflicting results.
Detailed Explanation
Indifference curves have distinct characteristics: they slope downwards, indicating a tradeoff between two goods; higher curves represent greater satisfaction; and they cannot intersect. If two curves intersected, it would suggest that the same bundle of goods provides multiple levels of satisfaction, which contradicts the basic premise of consumer preferences.
Examples & Analogies
Consider a scenario with a traveler choosing between two hotel types: budget and luxury. The downward slope indicates they have to give up some luxury hotels to afford more budget hotels. The traveler prefers the luxury hotels on a higher curve for greater comfort, and if luxury hotels meet a lower curve's standard, it's illogical as they represent different levels of satisfaction.
Key Concepts
-
Indifference Curve: A graphical depiction of combinations of goods that yield equal utility.
-
Marginal Rate of Substitution: The rate at which one good can be substituted for another while keeping satisfaction unchanged.
-
Indifference Map: A collection of indifference curves representing consumer preferences.
-
Monotonic Preferences: A property of preferences that indicates the consumer always prefers more of at least one good.
Examples & Applications
If a consumer is indifferent between (4 bananas, 2 mangoes) and (3 bananas, 3 mangoes), both combinations lie on the same indifference curve.
As a consumer increases the number of bananas they consume, they must give up some mangoes to stay at the same satisfaction level, illustrating the concept of diminishing marginal rate of substitution.
Memory Aids
Interactive tools to help you remember key concepts
Rhymes
If more bananas you want to acquire, give up mangoes, that's the desire!
Stories
Imagine a consumer at a market, trading mangoes for bananas, balancing satisfaction with every trade.
Memory Tools
MRS: More Relinquished for Satisfaction to remember Marginal Rate of Substitution.
Acronyms
IC
Indifferent Combinations which show equal satisfaction.
Flash Cards
Glossary
- Indifference Curve
A curve representing all combinations of two goods that give a consumer the same level of satisfaction.
- Marginal Rate of Substitution (MRS)
The rate at which a consumer is willing to give up one good in exchange for another good while maintaining the same level of utility.
- Monotonic Preferences
Consumer preferences where more of one good is always preferred to less, holding the level of other goods constant.
- Indifference Map
A graphical representation of a consumer's preferences across multiple indifference curves.
Reference links
Supplementary resources to enhance your learning experience.