
Marginal Rate of Substitution (MRS)
Enroll to start learning
You’ve not yet enrolled in this course. Please enroll for free to listen to audio lessons, classroom podcasts and take practice test.
Interactive Audio Lesson
Listen to a student-teacher conversation explaining the topic in a relatable way.
Introduction to MRS
🔒 Unlock Audio Lesson
Sign up and enroll to listen to this audio lesson

Today we are going to talk about the Marginal Rate of Substitution, or MRS. Can anyone tell me what MRS means?

Isn't it how much of one good a person will give up for another good?
Exactly! MRS measures the rate at which consumers are willing to substitute one good for another while keeping their satisfaction level the same. For example, how many mangoes would you be willing to give up for an additional banana?

So, it’s about maintaining the same level of utility?
Correct! That's a key point. Does anyone know the formula for calculating MRS?

Is it MRS = |∆Y / ∆X|?
Yes! You got it! MRS is the absolute value of the change in Y divided by the change in X. Remember this formula when we talk about indifference curves!
Diminishing Marginal Rate of Substitution
🔒 Unlock Audio Lesson
Sign up and enroll to listen to this audio lesson

Now, let's dive deeper into the concept of diminishing MRS. Why do you think it diminishes as we consume more of one good?

Maybe because as you get more of one good, you don't need to give up as much of the other?
Precisely! This phenomenon is called the law of diminishing MRS. As you consume more bananas, you are willing to sacrifice fewer mangoes for each additional banana. Can someone summarize this in their own words?
So, if I have 5 bananas already, I might trade one mango for one more banana, but if I have 10 bananas, I would trade maybe only half a mango.
Great explanation! That's the essence of MRS diminishing — it illustrates your preference changing as saturation occurs.
Application of MRS in Demand Curves
🔒 Unlock Audio Lesson
Sign up and enroll to listen to this audio lesson
How do you think MRS connects to the demand curve we learned before?
I think it shows how quantity demanded changes with price change, right?
Exactly! The MRS helps to derive the demand curve based on consumer preferences. As the price of bananas decreases, you'd want more bananas because of the lower opportunity cost.
And that’s why the demand curve slopes downwards because demand increases as prices decrease.
Exactly! Now can you all think of any real-life applications of this concept?
When people choose between different brands of food they like, they decide how much more of one they want based on the price of the other.
A great example! That is MRS in action! It directly influences marketing and pricing strategies.
Introduction & Overview
Read summaries of the section's main ideas at different levels of detail.
Quick Overview
Standard
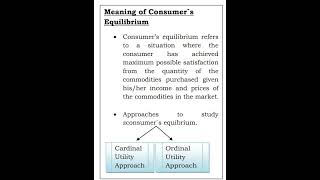
MRS reflects the consumer's trade-off between two goods while keeping utility constant. It shows how much of a good (e.g., mangoes) the consumer is willing to forfeit for an additional unit of another good (e.g., bananas). The concept is pivotal in both cardinal and ordinal utility analyses, revealing the diminishing nature of consumer preferences as they increase consumption.
Detailed
Marginal Rate of Substitution (MRS)
The Marginal Rate of Substitution (MRS) represents the rate at which a consumer is willing to substitute one good for another while maintaining the same level of utility. This concept is central to understanding consumer behavior in microeconomics, particularly within the context of indifference curves in ordinal utility analysis.
Key Points of MRS
- MRS is defined mathematically as the absolute value of the slope of the indifference curve at any given point
(MRS = |∆Y / ∆X|), where ∆Y is the change in the quantity of good Y (e.g., mangoes) and ∆X is the change in the quantity of good X (e.g., bananas). - The law of diminishing marginal rate of substitution states that as the consumer increases the consumption of one good (for example, bananas), they are willing to give up fewer units of the other good (mangoes) to get one more unit of the first good.
- The MRS diminishes as the quantity of good X consumed increases, meaning a consumer will sacrifice smaller amounts of good Y for additional units of good X.
Significance of MRS in Consumer Theory
- MRS guides the consumer’s choice and helps derive the demand curves based on the consumption bundles they prefer.
- Understanding how consumers substitute goods informs pricing, marketing strategies, and economic policies.
- It also aids in analyzing demands for complementary and substitute goods.
Youtube Videos


Audio Book
Dive deep into the subject with an immersive audiobook experience.
Definition of Marginal Rate of Substitution (MRS)
Chapter 1 of 3
🔒 Unlock Audio Chapter
Sign up and enroll to access the full audio experience
Chapter Content
The amount of mangoes that the consumer has to forego, in order to get an additional banana, her total utility level being the same, is called marginal rate of substitution (MRS). In other words, MRS is simply the rate at which the consumer will substitute bananas for mangoes, so that her total utility remains constant. So, MRS = |∆Y /∆X|.
Detailed Explanation
The Marginal Rate of Substitution (MRS) quantifies how many units of one good (in this case, mangoes) a consumer is willing to give up to obtain an additional unit of another good (bananas), without changing their overall satisfaction. This helps to understand consumer preferences and how they make trade-offs between different goods while still achieving the same level of utility.
Examples & Analogies
Imagine you're at an ice cream shop and there's a special where for every scoop of chocolate ice cream (the bananas) you want, you have to give up some scoops of vanilla ice cream (the mangoes) that you could have also had. If you are willing to give up 2 scoops of vanilla for 1 scoop of chocolate, your MRS is 2:1. This illustrates how consumers evaluate their choices based on what they are willing to sacrifice for more of something they prefer.
Law of Diminishing Marginal Rate of Substitution
Chapter 2 of 3
🔒 Unlock Audio Chapter
Sign up and enroll to access the full audio experience
Chapter Content
One can notice that, in the table 2.2, as we increase the quantity of bananas, the quantity of mangoes sacrificed for each additional banana declines. In other words, MRS diminishes with increase in the number of bananas.
Detailed Explanation
The Law of Diminishing Marginal Rate of Substitution states that as a consumer continues to substitute one good for another, the quantity of the good sacrificed for each additional unit of the other good decreases. Initially, giving up a few units of a less desired good for a more desired good seems worthwhile, but as more of the first good is consumed, the consumer is less willing to give up significant amounts of it for more of the second good.
Examples & Analogies
Consider a scenario where you are watching a movie and want popcorn. At first, you might give up a lot of chips for one more popcorn because you're eager. However, as you fill up on popcorn, you start becoming less willing to give up your chips. Thus, for each additional popcorn you want after the first few, you might only give up one chip or none at all. This illustrates the diminishing value of what you are willing to sacrifice as you gain more of something you enjoy.
Shape of the Indifference Curve
Chapter 3 of 3
🔒 Unlock Audio Chapter
Sign up and enroll to access the full audio experience
Chapter Content
The law of Diminishing Marginal Rate of Substitution causes an indifference curve to be convex to the origin.
Detailed Explanation
Indifference curves graphically represent combinations of two goods that provide equal satisfaction to the consumer. The convex shape of the indifference curve reflects the principle of diminishing marginal rates of substitution, indicating that as a consumer substitutes more of one good for another, the amount they are willing to give up per additional unit of the preferred good decreases.
Examples & Analogies
Imagine drawing an indifference curve of your desire for coffee and donuts. At first, you might be willing to trade two donuts for some extra coffee because you really want that caffeine boost. But as you continue to enjoy more coffee, your willingness to give away donuts for that additional cup lessens, resulting in a curve that bows inward towards the origin, showing that trade-offs change over time.
Key Concepts
-
Marginal Rate of Substitution (MRS): The rate at which a consumer substitutes one good for another while keeping the same satisfaction level.
-
Indifference Curve: A graphical representation showing combinations of goods that provide equal satisfaction to the consumer.
-
Diminishing MRS: As consumption of one good increases, the willingness to give up the other good decreases.
Examples & Applications
If a consumer can trade 3 mangoes for 1 banana at first but later would only trade 1 mango for 1 banana, this reflects diminishing MRS.
In a practical scenario, if bananas price drops, a consumer will swap fewer mangoes for additional bananas as they already enjoy a higher quantity.
Memory Aids
Interactive tools to help you remember key concepts
Rhymes
When the bananas increase in number, the mangoes fade like a slumber.
Stories
Imagine a consumer at a fruit shop who has a love for bananas. As they eat more bananas, they find they don’t mind trading away mangoes anymore, but they begin to hesitate as the bananas pile up!
Memory Tools
To remember MRS: 'More Resources Satisfied' implies trading off when managing consumption.
Acronyms
MRS
‘Make Room for Substitutes’ helps remember the substitution aspect.
Flash Cards
Glossary
- Marginal Rate of Substitution (MRS)
The rate at which a consumer is willing to give up one good in exchange for another while maintaining the same level of satisfaction.
- Indifference Curve
A graph representing various bundles of goods among which the consumer is indifferent.
- Utility
The satisfaction a consumer derives from consuming goods and services.
- Diminishing MRS
The principle stating that as a consumer increases consumption of one good, the rate at which they are willing to substitute another good decreases.
- Cardinal Utility
An approach that quantifies utility in numerical terms.
- Ordinal Utility
An approach defining utility based on preference rankings rather than numerical values.
Reference links
Supplementary resources to enhance your learning experience.