
Monotonic Preferences
Enroll to start learning
You’ve not yet enrolled in this course. Please enroll for free to listen to audio lessons, classroom podcasts and take practice test.
Interactive Audio Lesson
Listen to a student-teacher conversation explaining the topic in a relatable way.
Understanding Monotonic Preferences
🔒 Unlock Audio Lesson
Sign up and enroll to listen to this audio lesson

Today, we will explore the concept of monotonic preferences in consumer behavior. Can someone summarize what they think 'monotonic' means in this context?

I think it means that if one bundle has more of one good and the same or more of another good, then the consumer prefers that bundle.
Exactly! Monotonic preferences imply that consumers prefer having more of at least one good over another option that provides lesser quantity. This leads us to understand how preferences dictate their choices.

So, if I have a choice between two bundles, one with 5 bananas and 2 mangoes, and another with 6 bananas and 2 mangoes, I would clearly prefer the second one?
Correct! This preference reflects the increased satisfaction from having more bananas without losing out on any mangoes. Now, let's think about how this can be shown graphically.
Indifference Curves
🔒 Unlock Audio Lesson
Sign up and enroll to listen to this audio lesson

Now, who remembers what an indifference curve represents?

I think it's a graph that shows different bundles of goods that give the same satisfaction or utility.
Exactly! Each point on the curve shows a different combination of goods that keep the consumer's satisfaction constant. If we consider two goods, say bananas and mangoes, higher curves represent higher satisfaction levels.

But why can't these curves intersect?
Great question! They cannot intersect because that would imply conflicting preferences about which bundle provides higher utility, leading to an absurd situation. Let's remember this by saying 'No curves can cross without confusion!'
The Implications of Monotonic Preferences
🔒 Unlock Audio Lesson
Sign up and enroll to listen to this audio lesson
So, what implications do these monotonic preferences have on demand curves?
I think since consumers always prefer more, they would demand more of a good as its price decreases.
Exactly! The demand curve is negatively sloped because consumers respond to price changes with their preference for more quantity. This brings us to the relation between the slope of the demand curve and utility.
So, when prices lower, not only do we see more quantity demanded, but it's also because utility increases.
Absolutely right! Utility maximization leads to the observed behaviors in demand. Let’s summarize: Monotonic preferences lead to clearer choices, higher utility levels on higher curves, and a negative demand slope.
Introduction & Overview
Read summaries of the section's main ideas at different levels of detail.
Quick Overview
Standard
This section discusses monotonic preferences, where a consumer will choose a consumption bundle that provides more of at least one good, with no decrease in quantity for another good. These preferences lead to the concept of indifference maps, where preferences can be visualized through indifference curves that show combinations of goods yielding the same satisfaction.
Detailed
Monotonic Preferences
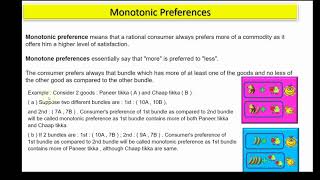
Monotonic preferences are a fundamental concept in consumer theory, stipulating that if one consumption bundle has more of at least one good, without having less of another good, it is preferred over another bundle. This property signifies that consumers always favor bundles that provide a greater quantity of any good because it aligns with their objective of maximizing utility.
In the context of consumer choice, the preferences can be represented graphically by indifference curves. These curves depict combinations of two goods where the consumer's satisfaction remains constant. An indifference map comprises multiple indifference curves representing different levels of utility. Monotonic preferences ensure that the indifference curves never intersect; as one moves to a higher curve, the consumer attains a higher utility level.
Key features of monotonic preferences include:
- Downward Sloping Behavior: Indifference curves slope downward, indicating that an increase in one good necessitates a decrease in the other to maintain the same utility level.
- Higher Utility on Higher Curves: Bundles on a higher indifference curve are preferred, indicating that more of at least one good results in greater satisfaction.
- Non-Intersection of Indifference Curves: Two curves cannot intersect because this would imply conflicting preferences about bundles that yield the same satisfaction level.
These preferences are vital for understanding how consumers make choices and derive demand curves based on the availability of goods and their individual preferences.
Youtube Videos


Audio Book
Dive deep into the subject with an immersive audiobook experience.
Definition of Monotonic Preferences
Chapter 1 of 4
🔒 Unlock Audio Chapter
Sign up and enroll to access the full audio experience
Chapter Content
Consumer’s preferences are assumed to be such that between any two bundles (x₁, x₂) and (y₁, y₂), if (x₁, x₂) has more of at least one of the goods and no less of the other good compared to (y₁, y₂), then the consumer prefers (x₁, x₂) to (y₁, y₂). Preferences of this kind are called monotonic preferences.
Detailed Explanation
Monotonic preferences mean that a consumer will always prefer a bundle that provides more of at least one good and does not reduce the amount of any other good. For example, if a consumer is presented with two bundles, say Bundle A with (3 bananas, 2 mangoes) and Bundle B with (4 bananas, 2 mangoes), the consumer will choose Bundle B because it contains more bananas without decreasing the number of mangoes.
Examples & Analogies
Think of monotonic preferences like choosing between two plates of food. If one plate has more of your favorite dish (like pasta) and the same amount of another dish (like salad), you would definitely prefer the plate with more pasta. It's a straightforward choice where preference leans towards having more of what you enjoy.
Indifference Map
Chapter 2 of 4
🔒 Unlock Audio Chapter
Sign up and enroll to access the full audio experience
Chapter Content
The consumer’s preferences over all the bundles can be represented by a family of indifference curves as shown in Figure 2.5. This is called an indifference map of the consumer. All points on an indifference curve represent bundles which are considered indifferent by the consumer.
Detailed Explanation
An indifference map is a graphical representation that shows different combinations of goods that provide the same level of satisfaction to the consumer. Each curve in the map reflects a different level of satisfaction. For instance, if a consumer is indifferent between consuming 3 bananas and 4 mangoes or 2 bananas and 5 mangoes, both combinations lie on the same indifference curve because they yield the same level of utility.
Examples & Analogies
Imagine you enjoy different combinations of your favorite fruits and sweets. If you feel equally satisfied with 3 apples and 2 chocolates as you do with 2 apples and 3 chocolates, both combinations form part of the same indifference curve, illustrating how your happiness remains unchanged regardless of the specific combination.
Features of Indifference Curves
Chapter 3 of 4
🔒 Unlock Audio Chapter
Sign up and enroll to access the full audio experience
Chapter Content
- Indifference curve slopes downwards from left to right: An indifference curve slopes downwards from left to right, which means that in order to have more of bananas, the consumer has to forego some mangoes.
- Higher indifference curve gives greater level of utility: As long as marginal utility of a commodity is positive, an individual will always prefer more of that commodity.
- Two indifference curves never intersect each other: Two indifference curves intersecting each other will lead to conflicting results.
Detailed Explanation
The downward slope of the indifference curve indicates that as a consumer wants to increase the quantity of one good (like bananas), they have to reduce the quantity of another good (like mangoes) to maintain the same level of satisfaction. Higher curves indicate more overall satisfaction, but no two curves can intersect, because it would imply contradictory preferences where a consumer could gain more satisfaction from having less of something.
Examples & Analogies
Consider a pizza lover who must choose between slices of pizza and soda. The more pizza they want, the less soda they feel they can drink to stay satisfied. If two slices of pizza and two sodas make them just as happy as four slices of pizza and one soda, these two combinations lie on different curves, representing increased satisfaction, but they won't cross because it would mean conflicting choices.
Conclusion on Monotonic Preferences
Chapter 4 of 4
🔒 Unlock Audio Chapter
Sign up and enroll to access the full audio experience
Chapter Content
Monotonic preferences imply that a consumer will always prefer having a higher quantity of at least one good with no decrease in quantity of others, leading to clear and logical consumer choices.
Detailed Explanation
In summary, monotonic preferences help simplify consumer decision-making by establishing that more is better, as long as other goods are not reduced. This principle underpins the way consumers view their choices and sets the foundation for understanding how they make purchasing decisions.
Examples & Analogies
Think about shopping at a grocery store. If you find that one brand of cereal offers double the size for the same price as another, your monotonically increasing preference will lead you to choose the larger size. This rational choice illustrates how the concept of monotonic preferences operates in everyday shopping conditions.
Key Concepts
-
Monotonic Preferences: Consumers will always prefer a bundle with more of at least one good.
-
Indifference Curves: Graphical representation of bundles that provide equal satisfaction.
-
Higher Utility: Bundles on higher curves provide greater satisfaction.
-
Non-Intersecting Curves: Indifference curves never intersect to maintain consistent preferences.
Examples & Applications
For instance, a consumer prefers a bundle of (6 bananas, 3 mangoes) to (4 bananas, 3 mangoes) because it provides more bananas.
When looking at combinations (5 bananas, 2 mangoes) vs (5 bananas, 4 mangoes), the consumer would prefer the latter for more mangoes.
Memory Aids
Interactive tools to help you remember key concepts
Rhymes
More of a good makes me glad, without less of another, I can’t be sad!
Stories
Imagine a shopper choosing fruits at a market, always reaching for extra bananas without reducing her mango count; this reflects her monotonic preference.
Memory Tools
M.O.R.E: Monotonic - One is preferred - Rise in utility - Equal satisfaction.
Acronyms
I.C.U. = Indifference Curves Unite different bundles of utility!
Flash Cards
Glossary
- Monotonic Preferences
Consumer preferences that indicate a choice of goods where more of at least one good is preferred without reducing the quantity of another.
- Indifference Curve
A graphical representation showing different combinations of goods that provide the same level of utility to the consumer.
- Indifference Map
A collection of indifference curves that represents all possible levels of utility for a consumer.
- Utility
The satisfaction or pleasure derived by the consumer from consuming goods or services.
Reference links
Supplementary resources to enhance your learning experience.