
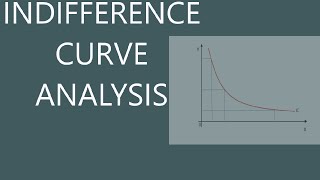
Shape of an Indifference Curve
Enroll to start learning
You’ve not yet enrolled in this course. Please enroll for free to listen to audio lessons, classroom podcasts and take practice test.
Interactive Audio Lesson
Listen to a student-teacher conversation explaining the topic in a relatable way.
Introduction to Indifference Curves
🔒 Unlock Audio Lesson
Sign up and enroll to listen to this audio lesson

Today we will start discussing indifference curves, which show combinations of two goods providing the same satisfaction to consumers. Can anyone tell me what we call the rate at which one good can be substituted for another while keeping the utility constant?

Is it the marginal rate of substitution, or MRS?
Exactly! The MRS is crucial. It diminishes as you substitute more of one good for the other. This is often depicted through a convex-shaped curve. Why do you think it's convex?

Maybe because you want to avoid giving up too much of one good for the other as you get more of it?
Great observation! The convexity reflects that need for balance and is fundamentally linked to diminishing marginal returns.
Exploring Perfect Substitutes
🔒 Unlock Audio Lesson
Sign up and enroll to listen to this audio lesson

Now, think about perfect substitutes. If good A and good B are perfect substitutes, how do their indifference curves look?

They would be straight lines, right? Because the MRS doesn’t change.
Correct! In such cases, a consumer is indifferent to the ratio of goods they consume. For instance, if you always want one chocolate for one banana, it appears as a straight line in an indifference diagram.

So, there’s no diminishing marginal utility there?
Exactly! There's no diminishing return effect unlike in regular indifference curves. Think of chocolate vs. apples; most prefer one over the other given more choices!
Understanding Monotonic Preferences
🔒 Unlock Audio Lesson
Sign up and enroll to listen to this audio lesson
Let's also discuss monotonic preferences. How does a consumer's monotonic preference inform their choices?
I think it means they prefer more of one good rather than less, as long as they have enough of the other!
That’s right! It implies that if you have more of any good without losing out on the other, you will be better off. This notion reinforces the downward sloping nature of our indifference curves.
So, does that mean two indifference curves can't intersect because it would contradict their preferences?
Exactly! Intersecting curves would confuse us about which combination gives higher satisfaction—a principle of order in consumer preferences.
Real-World Implications of Indifference Curves
🔒 Unlock Audio Lesson
Sign up and enroll to listen to this audio lesson
Finally, let’s think of how these curves apply in the real world, especially in decision making.
I guess when budgeting for groceries, knowing what I can substitute when prices change would be important.
Yes! Consumers adjust their preferences based on price fluctuations, which reflects their willingness to replace goods based on utility. Hence, understanding this curve is essential for both consumers and businesses.
So, businesses could use this info to adjust their pricing strategies?
Absolutely! Companies analyze consumer preferences to set prices and maximize their profits effectively.
Introduction & Overview
Read summaries of the section's main ideas at different levels of detail.
Quick Overview
Standard
The shape of an indifference curve is generally convex to the origin, reflecting the law of diminishing marginal rate of substitution. This section explains how the consumer substitutes one good for another while maintaining the same level of utility, illustrated with examples of perfect substitutes and monotonic preferences.
Detailed
Shape of an Indifference Curve
Indifference curves show all combinations of two goods that provide a consumer with the same level of satisfaction, indicating their preferences. The general shape of these curves is convex to the origin, illustrating the principle of diminishing marginal rate of substitution (MRS). This law states that as a consumer substitutes one good for another, the amount of the good being sacrificed will decrease with each additional unit consumed of the first good.
For example, if bananas are substituted for mangoes, the consumer will gradually sacrifice fewer mangoes to obtain additional bananas. This concept is key in understanding consumer choice and utility optimization. In contrast, perfect substitutes yield a linear indifference curve since the marginal rate of substitution remains constant regardless of the quantities consumed. The section concludes with the impact of monotonic preferences on the shape of indifference curves, emphasizing that a consumer will always prefer more of at least one good while maintaining the other good constant.
Youtube Videos


Audio Book
Dive deep into the subject with an immersive audiobook experience.
Convexity of the Indifference Curve
Chapter 1 of 4
🔒 Unlock Audio Chapter
Sign up and enroll to access the full audio experience
Chapter Content
It may be mentioned that the law of Diminishing Marginal Rate of Substitution causes an indifference curve to be convex to the origin. This is the most common shape of an indifference curve. But in case of goods being perfect substitutes, the marginal rate of substitution does not diminish. It remains the same.
Detailed Explanation
Indifference curves represent combinations of two goods that provide the same level of satisfaction to the consumer. The law of Diminishing Marginal Rate of Substitution indicates that as a consumer continually substitutes one good for another, the amount of the second good they are willing to give up decreases. This behavior leads to an indifference curve that is convex to the origin, meaning it bows inward. In contrast, if two goods are perfect substitutes, the consumer is not willing to give up any decreasing amount, leading to a straight-line indifference curve.
Examples & Analogies
Imagine you have a choice between apples and oranges. If you truly prefer both equally, the more apples you have, the less willing you are to give up oranges for more apples, because your overall satisfaction remains the same regardless of switching some apples for oranges. If you see them as interchangeable, the line represents a perfect substitute, hence it would not curve but be straight.
Perfect Substitutes
Chapter 2 of 4
🔒 Unlock Audio Chapter
Sign up and enroll to access the full audio experience
Chapter Content
Let’s take an example. A table representation showing the Law of Diminishing Marginal Rate of Substitution can clarify. Quantity of five rupees notes and Quantity of five rupees coins suggests that irrespective of how many five rupee notes the consumer has, they will sacrifice only one five rupee coin for a five rupee note. So these two commodities are perfect substitutes for the consumer and the indifference curve depicting these will be a straight line.
Detailed Explanation
When dealing with perfect substitutes, consumers are indifferent between two goods, allowing for constant trade-offs between them. The example discussed shows that for every additional five rupee note a consumer receives, they are willing to give up one five rupee coin, as both provide the same satisfaction. This results in a linear, straight-line indifference curve, rather than a convex curve that illustrates diminishing substitution levels, thereby indicating a constant rate of substitution.
Examples & Analogies
Consider a scenario where a consumer is choosing between two brands of bottled water that taste exactly the same. If one brand goes on sale, the consumer will buy more of this brand at the expense of the other brand without any decrease in satisfaction. Hence, for every bottle of one brand swapped, one bottle of the other is no longer needed — this straight-line represents that there is no diminishing marginal utility; they are perfect substitutes.
Monotonic Preferences
Chapter 3 of 4
🔒 Unlock Audio Chapter
Sign up and enroll to access the full audio experience
Chapter Content
Consumer’s preferences are assumed to be such that between any two bundles (x1, x2) and (y1, y2), if (x1, x2) has more of at least one of the goods and no less of the other good compared to (y1, y2), then the consumer prefers (x1, x2) to (y1, y2). Preferences of this kind are called monotonic preferences.
Detailed Explanation
Monotonic preferences imply that if a consumer has two bundles of goods, one that offers more of one good without reducing the quantity of another good, they will always prefer the first bundle. It signifies a logical and consistent preference behavior, which is an essential assumption in consumer theory as it helps in the analysis of consumer choices. It leads to the idea that as long as one good increases in quantity without the other decreasing, satisfaction increases.
Examples & Analogies
Think of a buffet where you can choose desserts. If a patron is given a choice of two plates — one with three pieces of cake (and zero pies) and another with just one piece of cake but three pies, the first plate will likely be preferred since it does not reduce the sweet options available. The concept here associates directly to monotonic preferences as choosing more goodies is always preferred.
Indifference Map
Chapter 4 of 4
🔒 Unlock Audio Chapter
Sign up and enroll to access the full audio experience
Chapter Content
The consumer’s preferences over all the bundles can be represented by a family of indifference curves as shown in Figure 2.5. This is called an indifference map of the consumer. All points on an indifference curve represent bundles which are considered indifferent by the consumer.
Detailed Explanation
An indifference map comprises multiple indifference curves, each representing different levels of satisfaction. The higher an indifference curve in the map, the greater the level of satisfaction it provides. Essentially, each curve clearly indicates how much of one good can be exchanged for another while still maintaining the same level of preference by the consumer.
Examples & Analogies
Visualize a map where each line (curve) depicts trails leading to different picnic spots, representing various meal combos. Higher positioned curves might lead to more gourmet meals while the lower ones might just include sandwiches. Consumers (picnickers) will always aim higher on the map, thus better satisfaction.
Key Concepts
-
Indifference Curve: Graphical representation of goods providing the same utility.
-
Marginal Rate of Substitution (MRS): Rate at which goods can be substituted.
-
Diminishing MRS: The tendency for consumers to need to sacrifice fewer units of the second good as they acquire more of the first.
-
Convex Shape of Indifference Curve: Refers to the general shape illustrating diminishing marginal rate of substitution.
-
Perfect Substitutes: Goods that can be swapped on a one-to-one basis.
Examples & Applications
If you are given two goods, bananas and apples, an indifference curve might show combinations like (2 bananas, 3 apples) and (3 bananas, 2 apples) that provide the same satisfaction.
Consider a consumer who has a linear preference for two brands of bottled water, making them perfect substitutes, resulting in straight-line indifference curves.
Memory Aids
Interactive tools to help you remember key concepts
Rhymes
In curves that sway and bend so fine, the more you trade, the less you'll find.
Stories
Once upon a time in a market lane, two goods were sold, both sought the same gain. A shopper learned to swap one for the other, making choices clear, like sister and brother.
Memory Tools
MRS (More Replaces Slowly): As you consume more of one good, you replace it slowly with the other.
Acronyms
PIC (Prefer Increasing Combinations)
Refers to how consumers always desire more of at least one good.
Flash Cards
Glossary
- Marginal Rate of Substitution (MRS)
The rate at which a consumer can give up one good for another good while maintaining the same level of satisfaction.
- Indifference Curve
A graph representing combinations of goods among which a consumer is indifferent.
- Perfect Substitutes
Goods that can be used in place of each other, providing the same level of utility.
- Monotonic Preferences
Consumer preferences that indicate a consumer will always prefer more of at least one good without losing any of the other.
- Convexity
A property of indifference curves reflecting diminishing marginal rates of substitution.
Reference links
Supplementary resources to enhance your learning experience.