
Movements along the Demand Curve and Shifts in the Demand Curve
Enroll to start learning
You’ve not yet enrolled in this course. Please enroll for free to listen to audio lessons, classroom podcasts and take practice test.
Interactive Audio Lesson
Listen to a student-teacher conversation explaining the topic in a relatable way.
Understanding Movements along the Demand Curve
🔒 Unlock Audio Lesson
Sign up and enroll to listen to this audio lesson

Today we will discuss how changes in the price of goods affect consumer demand. What happens to demand when prices increase or decrease?

I think demand goes down if the price goes up.
Exactly! This phenomenon is known as the Law of Demand. Can someone tell me the opposite situation?

The demand goes up when the price goes down!
Great! So, when prices drop and demand increases, it represents movement along the demand curve, indicating how price changes directly affect quantity demanded.
Exploring Shift in the Demand Curve
🔒 Unlock Audio Lesson
Sign up and enroll to listen to this audio lesson

Now let’s shift gears and talk about demand curves moving due to non-price factors. Can anyone name some of these factors?

Income changes could affect demand!
Exactly! An increase in consumer income typically shifts the demand curve to the right for normal goods. Student_4, can you think of any other factors?

Changes in consumer preferences could also shift it.
Correct! Additionally, changes in the price of related goods can affect demand, like substitutes or complements. Remember, shifts indicate a change in demand at all price levels.
Comparing Movements and Shifts
🔒 Unlock Audio Lesson
Sign up and enroll to listen to this audio lesson
Now let’s compare movements along the demand curve with shifts. Who can summarize the difference?
Movements happen due to price changes while shifts occur because of non-price factors.
That's right! Movements reflect changes in quantity demanded due to price, while shifts indicate a change in overall demand. Can anyone give an example of a shift?
If everyone suddenly loves smartphones, that could increase demand regardless of price!
Fantastic example! That perfectly illustrates how consumer preferences can lead to a shift in demand.
Introduction & Overview
Read summaries of the section's main ideas at different levels of detail.
Quick Overview
Standard
The section delves into how consumer demand for goods is affected by price changes, leading to movements along the demand curve, as well as how shifts in demand curves occur due to factors like income changes, preferences, and the price of related goods.
Detailed
In the context of consumer behavior, movements along the demand curve occur when there is a change in the price of the good, indicating a direct relationship between price and quantity demanded. When the price of a good falls, the quantity demanded increases, demonstrating the Law of Demand, whereas an increase in price leads to a decrease in quantity demanded. Conversely, shifts in the demand curve arise from changes in variables other than the price, such as consumer income, tastes, and prices of related goods. For instance, an increase in consumer income can shift the demand curve for normal goods to the right, while for inferior goods, it shifts to the left. Understanding these concepts is crucial for analyzing market dynamics and consumer behavior in economic theory.
Youtube Videos


Audio Book
Dive deep into the subject with an immersive audiobook experience.
Introduction to Demand Curve Movements
Chapter 1 of 3
🔒 Unlock Audio Chapter
Sign up and enroll to access the full audio experience
Chapter Content
As it has been noted earlier, the amount of a good that the consumer chooses depends on the price of the good, the prices of other goods, income of the consumer and her tastes and preferences. The demand function is a relation between the amount of the good and its price when other things remain unchanged. The demand curve is a graphical representation of the demand function. At higher prices, the demand is less, and at lower prices, the demand is more. Thus, any change in the price leads to movements along the demand curve.
Detailed Explanation
The demand curve represents how much of a good consumers are willing to buy at different prices. If the price of a good decreases, more people choose to buy it, resulting in a movement along the demand curve. Conversely, if the price increases, fewer people want to buy it, causing the demand to move down the curve.
Examples & Analogies
Imagine you are at a market. If a loaf of bread costs $5 and you need it, you might buy it, but if the price drops to $3, not only would you still buy it, but your friends might also buy more bread at this lower price. Thus, the lower price causes a movement along the demand curve.
Factors Leading to Demand Curve Shifts
Chapter 2 of 3
🔒 Unlock Audio Chapter
Sign up and enroll to access the full audio experience
Chapter Content
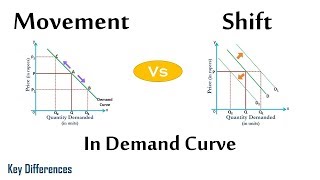
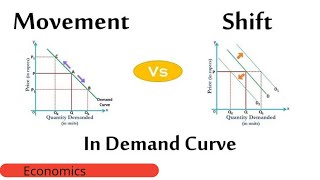
On the other hand, changes in any of the other things lead to a shift in the demand curve. Figure 2.17 illustrates a movement along the demand curve and a shift in the demand curve.
Detailed Explanation
A shift in the demand curve occurs when factors other than the price of the good change, such as consumer income, preferences, or prices of related goods. For instance, if people start preferring organic food, the demand curve for organic vegetables will shift to the right, indicating an increase in demand at all price levels.
Examples & Analogies
Think about how trends work. If everyone suddenly starts to love eating avocados, the demand for avocados will increase. Even if the price remains the same, the demand curve for avocados shifts to the right because more people want to buy them.
Visualizing Demand Movements and Shifts
Chapter 3 of 3
🔒 Unlock Audio Chapter
Sign up and enroll to access the full audio experience
Chapter Content
Movement along a Demand Curve and Shift of a Demand Curve. Panel (a) depicts a movement along the demand curve and panel (b) depicts a shift of the demand curve.
Detailed Explanation
Visual aids, such as graphs, help understand demand behaviors clearly. A movement along the demand curve is illustrated by points changing along the same curve in response to price changes, while a shift is shown by an entirely new curve, indicating a new level of demand due to changes in other factors.
Examples & Analogies
Imagine the demand for concert tickets. If ticket prices drop, you might decide to buy two tickets instead of one; that's a movement along the demand curve. But if a famous band announces a reunion and suddenly, more people want to go to concerts, the entire demand for those tickets shifts right, indicating many more people willing to buy tickets at the same price.
Key Concepts
-
Movements along the Demand Curve: Changes in quantity demanded due to price changes.
-
Shifts in the Demand Curve: Changes in demand at all price levels due to non-price factors.
Examples & Applications
If the price of bananas decreases, the quantity demanded increases, resulting in a movement along the demand curve.
If the consumer's income increases, it may shift the demand curve to the right for normal goods.
Memory Aids
Interactive tools to help you remember key concepts
Rhymes
When prices rise and stay the same, demand will decrease, that's the game!
Stories
Imagine a shopper in a store. Each time the price of cupcakes drops, they buy more. But when prices rise, they pull back, illustrating how demand reacts.
Memory Tools
R.I.D.E for shifts: R for income, I for tastes, D for related goods price, E for expectations.
Acronyms
D.A.M. for Demand
for Demand Curve
for Average price
for Movements.
Flash Cards
Glossary
- Demand Curve
A graphical representation of the relationship between the price of a good and the quantity demanded.
- Movements along the Demand Curve
Changes in quantity demanded resulting from a change in the price of the good.
- Shifts in the Demand Curve
Changes in demand at all price levels, due to factors like consumer income, preferences, or the price of related goods.
- Law of Demand
The principle stating that, all else equal, an increase in price results in a decrease in quantity demanded.
Reference links
Supplementary resources to enhance your learning experience.