
Law of Diminishing Marginal Utility
Enroll to start learning
You’ve not yet enrolled in this course. Please enroll for free to listen to audio lessons, classroom podcasts and take practice test.
Interactive Audio Lesson
Listen to a student-teacher conversation explaining the topic in a relatable way.
Understanding Utility
🔒 Unlock Audio Lesson
Sign up and enroll to listen to this audio lesson

Today, we'll discuss utility, which refers to the satisfaction derived from consuming goods. Can anyone give me an example of a good they enjoy?

I enjoy ice cream!
Great! How does that feeling change if you eat one scoop compared to five?

The first scoop is amazing, but after a while, I don't enjoy it as much.
Exactly! This brings us to the Law of Diminishing Marginal Utility. The more ice cream you consume, the less satisfaction you get from each additional scoop.

So are we saying that the first scoop is the most satisfying?
Yes! The first scoop has the highest utility and each subsequent scoop brings lower utility.

Can this law apply to other things, too?
Absolutely! It's a core concept of consumer choices in economics.
In summary, utility is about satisfaction, and as we consume more of a good, the satisfaction from additional units tends to decrease.
Marginal vs. Total Utility
🔒 Unlock Audio Lesson
Sign up and enroll to listen to this audio lesson

Now let's talk about total utility and marginal utility. Who can explain the difference?
Total utility is the total satisfaction I get, and marginal utility is the extra satisfaction from one more unit.
Exactly! If you have five scoops of ice cream and enjoy a total of 20 units of satisfaction, what happens when you eat the sixth scoop?
Maybe I only gain 1 more unit of satisfaction.
Correct! This additional unit of satisfaction from the sixth scoop is the marginal utility. As we consume more, notice how that marginal utility tends to diminish.
Does this mean I would pay less for that sixth scoop?
Yes! That’s why demand curves slope downwards. The more you consume, the less you'll want to pay for additional units.
In conclusion, total utility grows, but at a diminishing rate due to decreasing marginal utility.
Application of the Law of Diminishing Marginal Utility
🔒 Unlock Audio Lesson
Sign up and enroll to listen to this audio lesson
Now, let’s see how this law affects actual buying behavior. How do you think it influences how much of a product we buy?
If I know the next unit will give me less satisfaction, I might just not buy it.
Exactly! Consumers make choices based on the satisfaction they get versus the price they have to pay. That's why prices fall as demand increases in certain markets. Can anyone think of where you might see this?
I think it happens with seasonal snacks or drinks!
Very good observation! Seasonal items often see greater demand at the start, but as people consume more, the demand can decline if satisfaction drops.
To summarize, the Law of Diminishing Marginal Utility is crucial for understanding consumer choices and market dynamics.
Introduction & Overview
Read summaries of the section's main ideas at different levels of detail.
Quick Overview
Standard
The Law of Diminishing Marginal Utility indicates that as a consumer consumes successive additional units of a good, the satisfaction derived from each additional unit tends to decrease. This relationship is crucial for understanding demand curves in economics.
Detailed
The Law of Diminishing Marginal Utility states that as a consumer consumes more units of a good, the marginal utility, or the additional satisfaction received from each successive unit, declines. This principle is illustrated through the relationship between total utility and marginal utility, where total utility can increase, but at a diminishing rate. The law helps explain consumer choices and demand curves, showcasing that consumers will only be willing to pay less for each additional unit of a good as its marginal utility decreases.
Youtube Videos


Audio Book
Dive deep into the subject with an immersive audiobook experience.
Understanding Total Utility and Marginal Utility
Chapter 1 of 4
🔒 Unlock Audio Chapter
Sign up and enroll to access the full audio experience
Chapter Content
Total Utility: Total utility of a fixed quantity of a commodity (TU) is the total satisfaction derived from consuming the given amount of some commodity x. More of commodity x provides more satisfaction to the consumer. TU depends on the quantity of the commodity consumed. Therefore, TU refers to total utility derived from consuming n units of a commodity x.
Marginal Utility: Marginal utility (MU) is the change in total utility due to consumption of one additional unit of a commodity. For example, suppose 4 bananas give us 28 units of total utility and 5 bananas give us 30 units of total utility. Clearly, consumption of the 5th banana has caused total utility to increase by 2 units (30 units minus 28 units). Therefore, marginal utility of the 5th banana is 2 units.
Detailed Explanation
Total Utility (TU) refers to the overall satisfaction a consumer gets from consuming a specific quantity of a good, such as bananas. Marginal Utility (MU), on the other hand, reflects the additional satisfaction gained from consuming one more unit of that good. In the provided example, if consuming 4 bananas yields 28 units of utility, and consuming a 5th banana increases that utility to 30 units, the MU of the 5th banana is simply the difference, which is 2 units.
Examples & Analogies
Think of eating slices of pizza. The first slice might give you a lot of satisfaction because you were hungry. The second slice still feels great, but maybe not as much as the first. By the time you get to the fourth or fifth slice, you might still enjoy it, but the extra satisfaction you get from each additional slice decreases. This showcases the concept of diminishing marginal utility.
The Law of Diminishing Marginal Utility
Chapter 2 of 4
🔒 Unlock Audio Chapter
Sign up and enroll to access the full audio experience
Chapter Content
Usually, it is seen that the marginal utility diminishes with increase in consumption of the commodity. This happens because having obtained some amount of the commodity, the desire of the consumer to have still more of it becomes weaker. The same is also shown in the table and graph. Notice that MU becomes zero at a level when TU remains constant. In the example, TU does not change at the 5th unit of consumption and therefore MU = 0. Thereafter, TU starts falling and MU becomes negative.
Detailed Explanation
The Law of Diminishing Marginal Utility states that as a consumer consumes more units of a good, the additional satisfaction (marginal utility) gained from each successive unit tends to decrease. For instance, after a certain point, consuming more bananas might no longer bring any positive satisfaction (MU becomes zero) and eventually, if the consumer feels overly full, the enjoyment might even become negative (MU becomes negative). This graphically can be represented by a downward sloping curve where TU rises at a decreasing rate until it stabilizes and then declines.
Examples & Analogies
Consider a person enjoying ice cream on a hot day. The first scoop is delightful, the second scoop is still enjoyable, but by the time they reach the fifth scoop, they are likely to feel too full and might even start to dislike the taste. This reflects the diminishing marginal utility—the first few scoops are value-added, but as they keep eating, the additional pleasure diminishes.
Deriving Demand from Diminishing Marginal Utility
Chapter 3 of 4
🔒 Unlock Audio Chapter
Sign up and enroll to access the full audio experience
Chapter Content
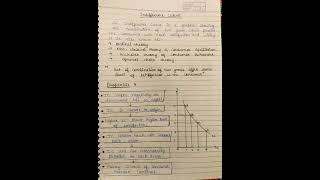
Cardinal utility analysis can be used to derive demand curve for a commodity. What is demand and what is demand curve? The quantity of a commodity that a consumer is willing to buy and is able to afford, given prices of goods and income of the consumer, is called demand for that commodity. Demand curve is a graphic presentation of various quantities of a commodity that a consumer is willing to buy at different prices of the same commodity.
Detailed Explanation
The relationship between price and demand is defined through the concept of diminishing marginal utility. As the price of a good decreases, consumers are willing to purchase more of that good because the additional satisfaction (marginal utility) they receive from each extra unit outweighs the cost. The demand curve graphically represents this relationship, showing the different quantities that consumers will buy at varying price levels. The curve is typically downward sloping due to the negative relationship between price and quantity demanded.
Examples & Analogies
Imagine you are at a market where apples are sold. If apples are priced at a high cost, say $3 each, you might only purchase one or two because the pleasure you get from eating them doesn't justify the high cost. However, if the price drops to $1, you can afford to buy more apples because the satisfaction you gain exceeds the cost, demonstrating how the demand curve shifts as prices change.
The Demand Curve and Consumer Choice
Chapter 4 of 4
🔒 Unlock Audio Chapter
Sign up and enroll to access the full audio experience
Chapter Content
The demand curve is a graphic representation of various quantities of a commodity that a consumer is willing to buy at different prices of the same commodity, while holding constant prices of other related commodities and income of the consumer.
Detailed Explanation
The demand curve visually illustrates the quantity of a good that consumers are willing to purchase at various prices, keeping all other factors constant (ceteris paribus). This helps demonstrate how changes in price impact consumer behavior, showing that as prices lower, the quantity demanded typically increases, reflecting the principles outlined in the law of demand.
Examples & Analogies
To relate this concept, think about how you react to sales when shopping. When a shirt goes on sale from $50 to $30, you might decide to buy it for that price because it fits your budget. If the price were to go back to $50, you might reconsider, highlighting how demand changes with price fluctuations.
Key Concepts
-
Marginal Utility: The additional satisfaction from consuming one more unit.
-
Total Utility: The total satisfaction from all consumed units.
-
Diminishing Marginal Utility: The principle that additional consumption yields less satisfaction.
-
Utility Function: A representation of preferences in terms of utility.
-
Demand Curve: Illustrates the relationship between price and quantity demanded.
Examples & Applications
Eating pizza: The first slice brings a lot of joy, but by the fourth or fifth slice, the enjoyment decreases.
Buying a new video game: The first few hours of play are exciting, but extra hours after that might yield less excitement.
Memory Aids
Interactive tools to help you remember key concepts
Rhymes
Diminishing utility is clever and neat, the more we consume, the less it's a treat.
Stories
Imagine a child with a box of chocolates. The first one brings joy, the second a smile, but by the fifth, the delight is mild.
Memory Tools
M.U. (Marginal Utility) drops like a stone when you consume and don't leave it alone.
Acronyms
D.M.U. - Diminishing Marginal Utility
- Decreases
- More consumption
- Utility drops.
Flash Cards
Glossary
- Marginal Utility
The additional satisfaction gained from consuming one more unit of a good or service.
- Total Utility
The total satisfaction derived from consuming a given total quantity of a good or service.
- Diminishing Marginal Utility
The principle that states that as a consumer consumes more of a good, the additional satisfaction derived from each additional unit decreases.
- Utility Function
A mathematical representation of a consumer's preferences, showing the satisfaction derived from different bundles of goods.
- Demand Curve
A graphical representation of the relationship between the price of a good and the quantity demanded.
Reference links
Supplementary resources to enhance your learning experience.