
Energy Gradient Line and Hydraulic Gradient Line
Enroll to start learning
You’ve not yet enrolled in this course. Please enroll for free to listen to audio lessons, classroom podcasts and take practice test.
Interactive Audio Lesson
Listen to a student-teacher conversation explaining the topic in a relatable way.
Understanding the Energy Gradient Line (EGL)
🔒 Unlock Audio Lesson
Sign up and enroll to listen to this audio lesson

Welcome, everyone! Today, we'll explore the Energy Gradient Line or EGL. The EGL helps us visualize the total mechanical energy along a pipeline. Can anyone tell me what components make up the EGL?

Isn't it made up of the elevation head, pressure head, and velocity head?
Great! Yes, the EGL combines all those components and determines the energy available for flow at different points. Remember this acronym 'E-PV-V' to help you recall it: Energy equals Potential, Velocity. Now, why do you think understanding the EGL is essential for engineers?

It helps us identify energy losses in the system?
Exactly! By analyzing the EGL, we can understand how energy dissipates due to factors like friction and turbulence.
Exploring the Hydraulic Gradient Line (HGL)
🔒 Unlock Audio Lesson
Sign up and enroll to listen to this audio lesson

Now, let’s discuss the Hydraulic Gradient Line or HGL. Who can explain how the HGL differs from the EGL?

Is it just the elevation and pressure head combined?
Exactly, Student_3! The HGL is essentially the elevation head plus the pressure head. This means it provides us with the height to which the liquid would rise in piezometer tubes. Can anyone remind me why this is useful in engineering?

It helps ensure that the pressure stays above atmospheric levels to avoid cavitation!
Precisely! Maintaining pressure is crucial to safe operations in pipeline systems. Always visualize how the HGL behaves along the pipeline as you assess pressure conditions.
Impact of Valves on Energy Losses
🔒 Unlock Audio Lesson
Sign up and enroll to listen to this audio lesson
Let’s move on to how valves influence energy losses in a pipeline. Can anyone name two types of valves we've discussed?
Gate valves and globe valves!
Correct! The gate valve is better for full flow control, while globe valves are commonly used for regulating flow. How might a half-open valve impact flow?
It creates more turbulence and thus more energy loss?
Right! A half-open valve does create vortex formations, which increases energy dissipation compared to fully open or closed conditions. Excellent observation!
Deriving Energy Losses
🔒 Unlock Audio Lesson
Sign up and enroll to listen to this audio lesson
Now, let’s explore how we can derive energy losses in a system. What equation helps us quantify these losses?
Bernoulli's equation?
That’s right! Modified Bernoulli’s equation incorporates energy losses due to factors like friction. Can someone summarize how we apply it to a two-pipe system?
We compare the energy at two points, accounting for losses along the way.
Exactly! It’s about comparing energy levels and understanding how friction and other factors diminish that energy in flow.
Sketching EGL and HGL
🔒 Unlock Audio Lesson
Sign up and enroll to listen to this audio lesson
Finally, let’s put everything we learned into practice by sketching the EGL and HGL on a pipe diagram. Who can describe how to approach this?
We start with the data points, like elevation and pressure at various locations.
Correct! And then we connect those points according to their gradients for both lines. Remember, the slope represents losses due to friction.
Are we also considering pumps in our sketches?
Of course! Pumps increase the EGL. Make sure to illustrate that clearly. A concise sketch can help us visualize the flow better and identify where potential improvements can be made.
Introduction & Overview
Read summaries of the section's main ideas at different levels of detail.
Quick Overview
Standard
The section discusses the energy gradient line (EGL) and hydraulic gradient line (HGL), emphasizing their roles in visualizing energy distribution and losses in fluid systems. It covers the effects of various factors, like valve types and flow conditions, on energy losses, illustrating the importance of these concepts in engineering applications such as pipe design and analysis.
Detailed
In fluid dynamics, understanding the energy gradient line (EGL) and hydraulic gradient line (HGL) is crucial for analyzing flow patterns in pipelines. The EGL represents the total mechanical energy available at various points along a pipeline, factoring in potential energy from elevation, kinetic energy from velocity, and energy losses due to friction and turbulence. The HGL, on the other hand, depicts the potential energy available by combining the elevation head with the pressure head, essentially serving as a tool for identifying energy losses throughout the system. The section emphasizes that energy gradient and hydraulic gradient lines are essential for engineers in designing and analyzing pipe systems, as they highlight the impacts of valve configurations, flow regimes, and frictional forces on overall system performance. By understanding and sketching these lines, engineers can effectively assess the necessary energy required to maintain desired fluid flow rates and ensure efficient system functionality.
Youtube Videos
![Hydraulic and Energy Grade Line ? with animation [ HGL and EGL ]](https://img.youtube.com/vi/moI4DQNirAw/mqdefault.jpg)

Audio Book
Dive deep into the subject with an immersive audiobook experience.
Understanding Energy and Hydraulic Gradient Lines
Chapter 1 of 3
🔒 Unlock Audio Chapter
Sign up and enroll to access the full audio experience
Chapter Content
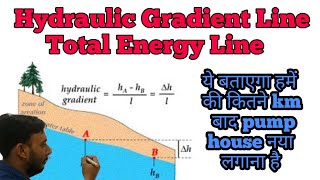
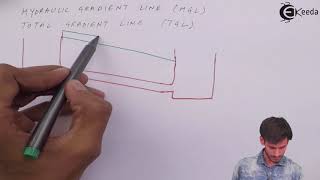
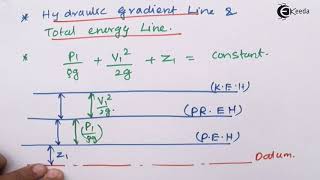
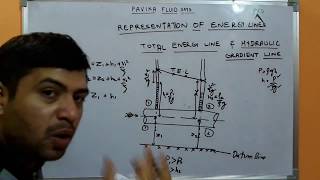
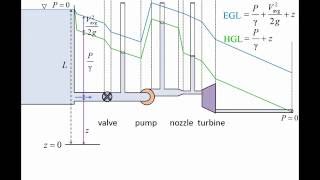
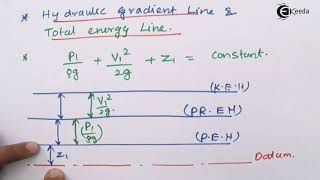
Now let us come to the energy gradient line and hydraulic gradient line that we discussed just after the Bernoulli’s equations. Let's say I have a reservoir. From the reservoir, I have the pipe systems and there is a pumping system. So, you can draw the hydraulic gradient line, and also we can draw the energy gradient line. The hydraulic gradient line will have the z plus the pressure head. Additionally, if you look at the velocity head, we will get the energy gradient line.
Detailed Explanation
Energy and hydraulic gradient lines are important in understanding the flow of fluids in a pipeline system. The energy gradient line represents the total energy per unit weight of the fluid, considering potential energy, pressure energy, and kinetic energy. On the other hand, the hydraulic gradient line shows the height of fluid due to pressure and elevation. The hydraulic gradient line can be affected by the pumping system which increases the total energy in the fluid, while the energy gradient line visualizes how energy is distributed along the length of the pipe. Understanding these lines helps engineers assess how much energy is available and how losses may occur due to friction and other factors.
Examples & Analogies
Imagine a roller coaster track. The hydraulic gradient line is like the height of the track at different points, while the energy gradient line represents the total energy of the roller coaster car at those points, factoring in its speed (kinetic energy) and height (potential energy). As the car moves along the track, it gains energy when going downhill (like being pushed by a pump) and loses energy due to friction and air resistance, similar to how fluid loses energy in a pipeline.
Effects of Pipe Flow and Energy Losses
Chapter 2 of 3
🔒 Unlock Audio Chapter
Sign up and enroll to access the full audio experience
Chapter Content
As the pipe flows down, you will have a drop of the potential head, that’s what drop is there. Similarly, if we look at there is a pumping system, it is increasing the energy. This is the increase of energy due to the pumping systems and increase of the velocity, which will make this energy gradient line rise. If there is a slope, that represents the major losses and frictional losses.
Detailed Explanation
When the fluid flows through a pipe due to gravity (represented by the drop in potential head), it experiences energy losses due to friction along the walls of the pipe and other resistances like bends or fittings. The energy gradient line reflects these losses; the steeper the line, the greater the energy loss. Pumps work against these losses by adding energy to the system, which is why you see the energy gradient line rising where there are pumps in the system. Engineers need to account for these losses when designing pipelines to ensure systems operate efficiently.
Examples & Analogies
Think of a water slide. As you go down the slide, you lose some energy due to friction with the slide's surface (similar to energy losses in a pipe). When you reach the bottom, there’s a pump mechanism that helps push you back up to the top for another ride. The energy used by this pump adds height (or potential energy) back into your ride, just like a pump adds energy back into the water in a pipeline system.
Importance of Gradient Lines in Engineering Design
Chapter 3 of 3
🔒 Unlock Audio Chapter
Sign up and enroll to access the full audio experience
Chapter Content
In any pipe flow system, you can sketch the energy gradient line and hydraulic gradient line. These lines indicate how flow patterns behave, how much velocity is present, and what energy is available at different points. It is vital for engineers to visualize and sketch these lines to interpret system performance.
Detailed Explanation
For engineers, understanding gradient lines is crucial for effective pipeline design. By sketching these lines, engineers can analyze where potential energy losses might occur and ensure that the designed system will function as intended. This practice also helps in communicating design ideas and system performance to other stakeholders.
Examples & Analogies
Consider a highway design. Just like engineers use models to visualize traffic flow, elevation changes, and potential bottlenecks, pipeline engineers use energy and hydraulic gradient lines to predict how fluid will flow through a system. If they know where the steep drops or obstacles are (like pumps), they can design routes (pipe systems) that minimize delays (energy losses) in reaching the destination.
Key Concepts
-
Energy Gradient Line (EGL): Visualizes the total energy available in a pipeline, encompassing potential, kinetic, and pressure energy levels.
-
Hydraulic Gradient Line (HGL): Indicates the elevation and pressure head within the fluid system, helping predict flow behavior.
-
Bernoulli's Equation: Fundamental equation relating energy components and losses, important in assessing fluid dynamics in pipes.
-
Valves Impact: Different valve types like gate and globe affect flow characteristics and energy losses.
Examples & Applications
In a piping system where a fluid flows from a higher elevation to a lower elevation, the EGL will drop based on the elevation change and energy losses due to friction.
When using a globe valve at a junction in a pipe, expect greater energy losses compared to a gate valve due to turbulence caused by the valve's design.
Memory Aids
Interactive tools to help you remember key concepts
Rhymes
EGL shows where energies lay, HGL is how fluid finds its way!
Stories
Imagine a water fountain where EGL is the height of the water jet, while HGL represents the water level in the reservoir.
Memory Tools
Remember 'E-PV-V' to recall components of EGL: Energy, Potential, Velocity.
Acronyms
HGL = Height (H) + Gravity (G) + Liquid (L)
Flash Cards
Glossary
- Energy Gradient Line (EGL)
A line that represents the total mechanical energy available at various points along a pipeline, including potential, kinetic, and pressure energy.
- Hydraulic Gradient Line (HGL)
A line that represents the potential energy available in a fluid system, combining elevation head and pressure head.
- Bernoulli's Equation
An equation that relates pressure, velocity, and elevation in fluid statics, modified to account for energy losses.
- Flow Regime
The pattern of fluid flow, characterized by its behavior as laminar or turbulent.
- Energy Loss Coefficient (K)
A factor that quantifies energy losses due to friction and turbulence in flow.
Reference links
Supplementary resources to enhance your learning experience.