
Using Moody's Diagram for Friction Factors
Enroll to start learning
You’ve not yet enrolled in this course. Please enroll for free to listen to audio lessons, classroom podcasts and take practice test.
Interactive Audio Lesson
Listen to a student-teacher conversation explaining the topic in a relatable way.
Understanding Valves in Fluid Systems
🔒 Unlock Audio Lesson
Sign up and enroll to listen to this audio lesson

Today, we will start by understanding how different valves, such as gate valves and globe valves, impact fluid flow. Can anyone explain what a gate valve does?

A gate valve controls the flow by opening or closing itself fully. It's like turning a faucet on and off.
Exactly! And what about globe valves? How do they compare?

Globe valves are better for throttling flow, right? They provide more control over the flow rate.
Correct! Remember, the type of valve impacts the energy losses due to flow turbulence and vortex formations. Let's remember this with the acronym V.E.S.T: Valves influence Energy loss and Streamline patterns in Turbulence!

So, if I understand correctly, where the valve is positioned and its type matters significantly?
Absolutely! The position and type of valve can dictate flow efficiency and pressure loss. Let’s discuss how we quantify these losses next.
Energy Losses in Pipe Systems
🔒 Unlock Audio Lesson
Sign up and enroll to listen to this audio lesson

Now let's dive into energy losses as water flows from one pipe to another. Remember, for compressible flow, Bernoulli’s equation helps us quantify energy loss. Can anyone tell me how?

We adjust Bernoulli’s equation for energy losses due to friction and fittings, right?
Spot on! This is known as the modified Bernoulli's equation. Can someone summarize how we apply it?
We look at the initial energy, accounting for head losses, and apply that to find the exit energy.
Perfect! Just to aid your memory, think of it as 'E-LEAF': Energy minus Losses equals Available Flow. Understanding this concept helps us gauge system efficiency.
So, would this also apply in cases where there are sudden contractions in pipes?
Exactly! Sudden changes in pipe diameter lead to increased energy losses. Let’s analyze how we can express these losses mathematically.
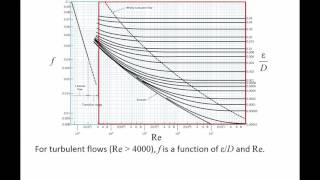
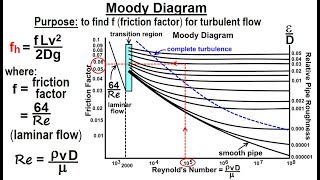
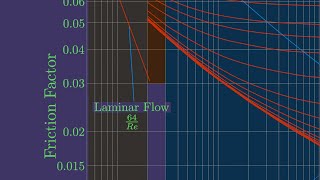
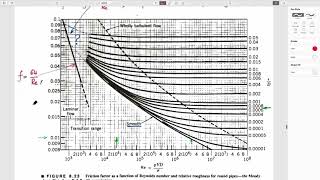
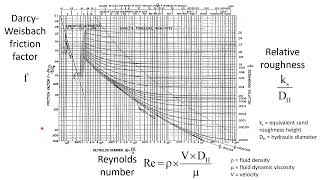
Using Moody's Diagram
🔒 Unlock Audio Lesson
Sign up and enroll to listen to this audio lesson
Now, let’s discuss Moody's Diagram, an essential tool for determining the friction factor in fluid systems. Who has seen this diagram before?
Yes! It shows friction factors based on Reynolds number and relative roughness.
Exactly! To find the friction factor, we first need the Reynolds number. Let's calculate it together. What’s the formula?
Re = (Density × Velocity × Diameter) / Viscosity.
Right! Once we have our Reynolds number, how do we find the friction factor using Moody's Diagram?
We locate the Reynolds number on the x-axis and then follow the appropriate roughness line to read off the friction factor?
Precisely! And if the exact value isn’t on the chart, we can interpolate between the lines. Remember the mnemonic 'Friction through the Chart' to keep it fluid and fun!
How do we apply these friction factors in practice?
Great question! We use these factors in our calculations of head losses to understand the performance of our flow systems.
Real-Life Applications
🔒 Unlock Audio Lesson
Sign up and enroll to listen to this audio lesson
Finally, let’s apply what we've learned to a practical scenario. Can you think of a situation where you’d need to consider these factors?
In designing a water distribution system, you'd want to minimize turbulence to ensure efficiency.
Exactly! Remember that minimizing turbulent flow not only reduces energy loss but also prolongs the system's lifespan. Let’s consider a design question together.
In that case, choosing larger pipe diameters and fewer bends would be ideal?
Absolutely! Utilizing the principle 'Bigger is Better' helps in reducing friction losses. Why don't you sketch a design considering our discussion today?
This makes a lot more sense now! I see how all these principles link together.
Fantastic! Remember, understanding these concepts is key to being an effective designer in fluid systems.
Introduction & Overview
Read summaries of the section's main ideas at different levels of detail.
Quick Overview
Standard
In this section, we explore the use of Moody's Diagram to assess friction factors for different flow scenarios in pipes. We discuss key principles such as mass conservation, linear momentum equations, and Bernoulli's energy conservation, emphasizing the implications of valve types and hydraulic conditions on flow efficiency.
Detailed
Detailed Summary of Section 6.2: Using Moody's Diagram for Friction Factors
In this section, we delve deeply into the use of Moody's Diagram, a critical tool for engineers to determine friction factors in fluid flow systems. The discussion begins with the importance of mass conservation equations and the application of linear momentum and Bernoulli's equations in fluid dynamics. We introduce the concept of valves, particularly differentiating between gate and globe valves, to illustrate how they affect fluid flow and energy loss.
Key concepts include:
1. Streamline Analysis: Understanding streamline patterns based on valve configurations and flow conditions, including vortex formations which contribute to energy dissipation.
2. Energy Loss Calculations: Analyzing energy losses during flow transitions in pipes of varying diameters and understanding their dependency on flow types (laminar vs. turbulent).
3. Application of Bernoulli's Equation: Addressing head losses through modified Bernoulli’s equations that account for various energy losses due to fittings and valves.
4. Utilization of Moody's Diagram: Students are guided on how to derive friction factors from the Moody's Diagram through given parameters such as Reynolds numbers and pipe roughness.
5. Practical Examples and Formulations: The section concludes with examples that combine theoretical concepts with practical problems and the application of energy gradient lines in design considerations.
This comprehensive approach helps students grasp the intricate relationships between fluid dynamics, system design, and practical applications of theoretical principles.
Youtube Videos


![Turbulent Flow: Moody Chart [Fluid Mechanics #41]](https://img.youtube.com/vi/tISdp_394Bw/mqdefault.jpg)

Audio Book
Dive deep into the subject with an immersive audiobook experience.
Understanding Flow Control with Valves
Chapter 1 of 6
🔒 Unlock Audio Chapter
Sign up and enroll to access the full audio experience
Chapter Content
If you look it that most of the times also we have a valve to control the flow okay which is a gate valve okay, it is a gate type of systems. If you rotate it this valve closes the waters okay. And it can have a total open or half closed and all these conditions to regulate the flow to regulate the flow we have a these systems.
Detailed Explanation
This chunk explains how valves, like gate valves, control the flow of water in a system. When the valve is fully open, it allows maximum flow, while partially closing the valve reduces the flow rate. Understanding how these valves operate is essential for managing water flow in hydraulic systems, as they can lead to different flow conditions depending on their position.
Examples & Analogies
Think of a faucet at home. When you turn the faucet handle to the right, it opens and allows water to flow freely. If you turn it to the left (closing it), the water flow reduces, just like the gate valve. This simple action demonstrates how adjusting a valve controls the amount of water flowing through a pipe.
Flow Patterns and Energy Dissipation
Chapter 2 of 6
🔒 Unlock Audio Chapter
Sign up and enroll to access the full audio experience
Chapter Content
Now if you look it if I am to draw the streamlines, how it happens it. So streamlines will come like this okay. There could be the vortex formations. And if you try to understand it, that I have not this open or the totally close, if the half open your flow distributions you can understand it how the streamlines patterns will come, how the vortex formations will have.
Detailed Explanation
This chunk focuses on how water flows through a valve and the resulting streamlines, which are visual representations of fluid flow. It describes how the position of the valve (open, closed, or partially open) affects the distribution of flow and the formation of vortices. Understanding these flow patterns is crucial for predicting how energy is dissipated in the system and identifying potential problem areas such as turbulence.
Examples & Analogies
Imagine observing how a river flows around a rock. When the water is flowing quickly past the rock, you can see smooth streamlines. However, if there's an obstruction or the water flows too fast around a narrow bend, vortexes form, creating swirling patterns. Similarly, in pipes, valves can create these complex flow patterns that engineers need to analyze to ensure efficient operation.
Applying Mass Conservation and Momentum Equations
Chapter 3 of 6
🔒 Unlock Audio Chapter
Sign up and enroll to access the full audio experience
Chapter Content
So the basically the strategy is that you should try to understand these ones. ...this is my control volume part. I can consider it that or I can consider this is the control volume. The most of that we will use the linear momentum efflux...
Detailed Explanation
This section talks about the application of mass conservation and linear momentum equations in the context of fluid flow. Mass conservation means that the mass entering a system must equal the mass leaving, which is crucial for calculating flow rates at different points in a pipe. Linear momentum equations help in analyzing the forces acting on the fluid within the control volume. These principles are foundational in fluid mechanics and are essential for designing efficient piping systems.
Examples & Analogies
Picture a busy highway where cars are entering and leaving at different points. If more cars enter than exit, there will be congestion. The same principle applies in fluid flow: if more water is injected into a pipe than is allowed to flow out, the pressure will increase, potentially causing issues. By applying mass conservation and momentum equations, engineers ensure the system is balanced, much like ensuring traffic flow is smooth with appropriate entrance and exit ramps.
Understanding Energy Losses in Pipe Systems
Chapter 4 of 6
🔒 Unlock Audio Chapter
Sign up and enroll to access the full audio experience
Chapter Content
Now coming to this, I am just applying the linear momentum equations for these control volumes okay. ...you will get it this part. Okay, this is very simple just to rearrange the part and you will get it.
Detailed Explanation
This chunk emphasizes the importance of understanding energy losses occurring within a pipe system when fluid flows through it. Energy losses can arise from friction, bends, and valves, which dissipate energy as heat or turbulence. By applying linear momentum equations and incorporating energy loss calculations, engineers can effectively predict and mitigate these losses, ensuring the system operates efficiently.
Examples & Analogies
Think about riding a bike uphill. You need more energy (pedaling power) to overcome not just the incline (which is like friction) but also any resistance from wind and rough ground (akin to a valve or bend in a pipe). If you're trying to conserve energy, you would want to find the easiest path up, similar to how engineers design piping systems to minimize energy losses.
Using Bernoulli's Equation to Analyze Flow
Chapter 5 of 6
🔒 Unlock Audio Chapter
Sign up and enroll to access the full audio experience
Chapter Content
Now I will applying Bernoulli’s equations along the straight line, okay I am just applying the Bernoulli’s equation along the straight line.
Detailed Explanation
This section introduces Bernoulli's equation, which relates pressure, velocity, and height in fluid flow. The equation helps to analyze how energy is conserved in fluid motion while accounting for losses. By applying it along a streamline, engineers can determine how much energy is retained across different points in a system, which is essential for efficient design.
Examples & Analogies
Imagine water flowing through a telescope-shaped fountain. At the bottom, the water has less pressure but a high velocity. As it rises through the narrower part of the fountain, it speeds up but pressures drop due to energy conservation principles. Bernoulli’s equation enables designers to predict these changes and adjust their designs to maintain effective flow.
Introduction to Moody's Diagram
Chapter 6 of 6
🔒 Unlock Audio Chapter
Sign up and enroll to access the full audio experience
Chapter Content
For the gradual contraction or for gradual enlargement, the friction factor K is given by...
Detailed Explanation
This chunk introduces Moody’s Diagram, a fundamental tool for determining the friction factor in fluid flow. The friction factor is critical for calculating head losses due to friction in pipes. Moody's Diagram provides a convenient way to visualize the relationship between Reynolds number and relative roughness of various pipe materials.
Examples & Analogies
Imagine you're shopping for tires. Different tires perform differently depending on the surface (wet, dry, rough, smooth). Moody’s Diagram works similarly, helping engineers understand how specific pipe materials will behave under different flow conditions by showing the friction factor based on the flow characteristics.
Key Concepts
-
Moody's Diagram: A graphical tool used to find friction factors based on flow conditions.
-
Energy Losses: Losses encountered due to friction and turbulence in fluid flow.
-
Reynolds Number: A dimensionless number indicating flow type (laminar or turbulent).
-
Bernoulli's Principle: A fundamental equation for understanding energy conservation in fluid movement.
-
Valve Types: Different valves like globe and gate valves impact energy loss and flow control.
Examples & Applications
Example 1: Using Moody's Diagram, calculate the friction factor for oil flow in a commercial steel pipe with a given Reynolds number and roughness.
Example 2: Find the energy loss due to a globe valve in a plumbing system given its coefficient and the flow parameters.
Memory Aids
Interactive tools to help you remember key concepts
Rhymes
In pipes where fluids flow, Gates and globes will show us so. Choose your valves, take a look, Energy loss is no open book.
Stories
Imagine walking through a house with different taps. A gate valve is the simple knob that takes you to the world of flowing water, while a globe valve leads you through twists and turns of flow control.
Memory Tools
F-MAP: Friction factors, Momentum, Area, Pressure - remember these when analyzing fluid flow.
Acronyms
B.E.E.
Bernoulli's Equation Explains - a tool for evaluating energy in fluid systems.
Flash Cards
Glossary
- Moody's Diagram
A graphical representation used to determine the friction factor of different flow conditions in pipes based on Reynolds number and relative roughness.
- Friction Factor
A dimensionless number used in fluid mechanics to describe the resistance of flow in a pipe due to friction.
- Bernoulli's Equation
An equation that describes the conservation of energy in flowing fluids, accounting for pressure, kinetic, and potential energy.
- Reynolds Number
A dimensionless quantity that helps predict flow patterns in different fluid flow situations; calculated from fluid velocity, characteristic length, and kinematic viscosity.
- Gate Valve
A valve that operates by lifting a gate out of the path of the fluid, providing minimal resistance to flow when fully open.
- Globe Valve
A valve used for regulating flow in a pipeline that has good throttling capabilities, shaped like a globe.
- Energy Losses
The loss of energy (typically in terms of head) due to friction and turbulence in flowing fluids, usually quantified in engineering applications.
Reference links
Supplementary resources to enhance your learning experience.