
Time and Frequency Domain Analysis
Enroll to start learning
You’ve not yet enrolled in this course. Please enroll for free to listen to audio lessons, classroom podcasts and take practice test.
Interactive Audio Lesson
Listen to a student-teacher conversation explaining the topic in a relatable way.
Introduction to Time Domain Analysis
🔒 Unlock Audio Lesson
Sign up and enroll to listen to this audio lesson

Today we're focusing on how we analyze system responses in both the time and frequency domains. Let’s start with time domain analysis. Who can tell me what we analyze in the time domain?

We look at how the system responds over time, especially after an input change.
That's right! We evaluate parameters like rise time and settling time. Does anyone know what rise time specifically refers to?

Is it the time it takes for the output to rise from 10% to 90% of its final value?
Exactly! And why is that important?

It shows how quickly the system can respond to changes in input!
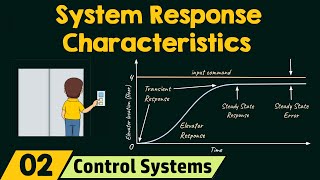
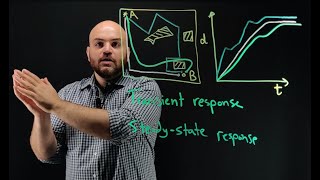
Great! Now, let’s summarize. Time domain analysis helps us understand system responses by looking at rise time, settling time, and overshoot.
Key Techniques in Time Domain Analysis
🔒 Unlock Audio Lesson
Sign up and enroll to listen to this audio lesson

Now, let’s talk about techniques. One crucial method we use in time domain analysis is the Laplace transform. Who can explain what that is?

It’s a mathematical technique used to convert time domain functions into frequency domain functions.
Yes! This allows us to analyze systems more easily. Can anyone think of a scenario where we might want to utilize the Laplace transform?
When dealing with complex differential equations that describe system dynamics.
Good point! And once we perform the Laplace transform, what do we look for?
We analyze the system's stability and transient behavior using the transformed equations!
Exactly! Remember, mastering these techniques helps in understanding how our systems behave over time.
Introduction to Frequency Domain Analysis
🔒 Unlock Audio Lesson
Sign up and enroll to listen to this audio lesson
Shall we transition to the frequency domain analysis? What do we try to uncover here?
We look at how systems respond to different frequencies of input signals.
Correct! One of the tools we can use is the Bode plot. Who can describe what a Bode plot reveals?
It shows the system's gain and phase shift across a range of frequencies.
Well done! This helps us understand the frequency response and stability of our system. Why is studying frequency responses important?
It lets us know how the system performs under different operating conditions.
Exactly! By examining frequency responses, we can better reject disturbances and design effective systems.
Combining Time and Frequency Domain Methods
🔒 Unlock Audio Lesson
Sign up and enroll to listen to this audio lesson
Now that we’ve discussed both domains, why do you think it's beneficial to combine time domain and frequency domain analysis?
Combining them gives us a comprehensive understanding of system performance.
Correct! Each provides unique insights. Can anyone give an example of what we might discover using both analyses?
We might discover that a system has a fast rise time in the time domain but poor stability in the frequency domain.
Exactly! By understanding both aspects, we can optimize our systems for speed and stability. Let’s recap: both domains are crucial for designing effective systems.
Introduction & Overview
Read summaries of the section's main ideas at different levels of detail.
Quick Overview
Standard
This section elaborates on time and frequency domain analysis, discussing how these methods can be used to evaluate system responses through various techniques including differential equations, Laplace transforms, Bode plots, and Nyquist plots.
Detailed
Time and Frequency Domain Analysis
Both time and frequency-domain methods can be employed to analyze system responses effectively. Time domain analysis assesses a system's behavior over time by solving differential equations and using techniques such as Laplace transforms to convert between domains. Key parameters evaluated include rise time, settling time, overshoot, and steady-state error.
On the other hand, frequency domain analysis utilizes Bode and Nyquist plots to inspect frequency responses and stability, offering insights into a system's ability to reject disturbances and perform across different frequencies (bandwidth). Additionally, steady-state error constants play a vital role in determining the system's accuracy under varying input conditions. By understanding these domains, engineers can enhance the design and performance of control systems.
Youtube Videos

Audio Book
Dive deep into the subject with an immersive audiobook experience.
Time Domain Analysis
Chapter 1 of 2
🔒 Unlock Audio Chapter
Sign up and enroll to access the full audio experience
Chapter Content
- Time Domain Analysis:
- Evaluate the system's time-domain response by solving the system’s differential equations.
- Common techniques include Laplace transforms and inverse Laplace transforms to move between time and frequency domains.
- Analyze key parameters like rise time, settling time, overshoot, and steady-state error.
Detailed Explanation
Time domain analysis focuses on how a system reacts over time in response to inputs. This evaluation involves solving differential equations that describe the system's dynamics. One commonly used method is the Laplace transform, which simplifies the process by converting differential equations into algebraic equations in the frequency domain, making them easier to manipulate. After analyzing the system in the frequency domain, the inverse Laplace transform is used to convert back to the time domain. Important parameters to consider during this analysis include rise time (the time it takes for the system output to rise to a specific percentage of its final value), settling time (the time taken for the system to settle within a certain range of its final value), overshoot (the extent to which the output exceeds its final value, expressed as a percentage), and steady-state error (the difference between the desired output and the actual output after sufficient time has passed).
Examples & Analogies
Imagine you're baking a cake. The time domain analysis is like monitoring the cake in the oven over time. You check how quickly it rises (rise time), when it stops bubbling and settles (settling time), if it overflowed the pan (overshoot), and how close it is to the recipe's expected outcome (steady-state error). Like baking, understanding how your system behaves over time helps ensure that it performs correctly.
Frequency Domain Analysis
Chapter 2 of 2
🔒 Unlock Audio Chapter
Sign up and enroll to access the full audio experience
Chapter Content
- Frequency Domain Analysis:
- Use Bode plots or Nyquist plots to study the frequency response and stability.
- Analyze the system's ability to reject disturbances and how it performs at various frequencies (bandwidth).
- Use steady-state error constants to determine the system’s accuracy under different inputs.
Detailed Explanation
Frequency domain analysis shifts focus from time to frequency, assessing how a system behaves when subjected to different frequencies of inputs. This analysis employs graphical tools, such as Bode plots and Nyquist plots, to visualize frequency response and stability. Bode plots display gain and phase shift as functions of frequency, while Nyquist plots help analyze stability and the potential for oscillations. Additionally, this analysis helps determine how effectively a system can reject disturbances at different frequencies and identifies its bandwidth. Key characteristics of the system, such as steady-state error constants, allow engineers to quantify how accurately the system tracks different types of inputs, such as step inputs, ramp inputs, or parabolic inputs.
Examples & Analogies
Consider tuning a musical instrument. Just like you adjust the tension of strings or the length of tubes based on the right frequencies (frequency domain analysis), engineers tune systems based on how well they respond at those frequencies. If an instrument doesn’t resonate well at certain notes, it becomes harder to play melodies correctly, just as a control system that struggles with specific frequencies may not perform optimally, leading to errors and instability in its response.
Key Concepts
-
Time Domain Analysis: Evaluates system performance over time.
-
Frequency Domain Analysis: Analyzes system performance across frequencies.
-
Laplace Transform: Converts time domain representation to frequency domain.
-
Bode and Nyquist Plots: Visual tools for understanding system responses in frequency.
Examples & Applications
An engineer uses the Laplace transform to simplify a differential equation describing a physical system's response.
A control system design utilizes Bode plots to analyze gain and phase shift for ensuring stability.
Memory Aids
Interactive tools to help you remember key concepts
Rhymes
In the time domain, we rise and settle, catch the transient, let it settle like a metal.
Stories
Imagine a race where cars start fast but wobble later; understanding speed and control helps avoid crashes.
Memory Tools
Remember T-REMS for Time Domain: Transient, Rise Time, Error, Magnitude, Settling time.
Acronyms
Bode plots show P.E.S.T
Phase
Error
Stability
and Time in the frequency realm.
Flash Cards
Glossary
- Time Domain Analysis
Evaluates a system's behavior over time using differential equations.
- Frequency Domain Analysis
Examines a system's response across different frequencies.
- Laplace Transform
Mathematical technique to convert time functions into frequency space.
- Bode Plot
Graphical representation showing a system's frequency response.
- Nyquist Plot
A graph representing the frequency response of a control system in complex plane.
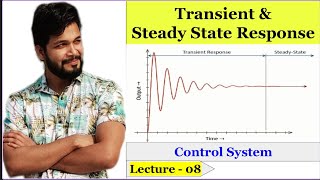
- Transient Response
The system's immediate reaction after a change in input.
- SteadyState Response
The behavior of the system after it has settled and reached equilibrium.
Reference links
Supplementary resources to enhance your learning experience.