
Common Debugging Techniques
Enroll to start learning
You’ve not yet enrolled in this course. Please enroll for free to listen to audio lessons, classroom podcasts and take practice test.
Interactive Audio Lesson
Listen to a student-teacher conversation explaining the topic in a relatable way.
Print Statements
🔒 Unlock Audio Lesson
Sign up and enroll to listen to this audio lesson

Let's begin with one of the most straightforward debugging techniques: print statements. Can someone tell me how print statements might be used effectively?

I think they help show the value of variables at different points in the program.
Exactly, Student_1! By inserting `System.out.println()`, you can monitor the flow and state of the code. It's a simple yet powerful tool. One thing to remember is to remove them once the debugging is done.

What if there are too many print statements? It's hard to sift through them.
That's a great point, Student_2! It's essential to use them judiciously. Try to print only the variables you need for that specific issue.
To help remember, think of the acronym P.E.E.R. - Print, Evaluate, Eliminate, Review. Use print statements to Print values, Evaluate logic, Eliminate possibilities, and Review results.
Logging Frameworks
🔒 Unlock Audio Lesson
Sign up and enroll to listen to this audio lesson

Now, let's discuss logging frameworks such as Log4j. Why might they be a better choice than print statements?

They can categorize messages and give more context, right?
Absolutely! Logging frameworks can filter messages by severity levels like DEBUG, INFO, ERROR, etc. This makes it easier to analyze behavior in production environments without clutter.

Can we easily turn them off in production?
Yes, Student_4! Most logging frameworks allow for configuration, so you can control logging levels dynamically without changing the code.
Let's remember L.O.G. - Levels, Output, and Granularity. This can help us apply logs effectively!
IDE Debugging Tools
🔒 Unlock Audio Lesson
Sign up and enroll to listen to this audio lesson
Next, let's talk about IDE debuggers. What features do you think they offer to help with debugging?
I know they let you set breakpoints to stop the program at certain points.
Correct! Breakpoints are crucial for investigating specific sections of code. You can also step through the code line by line with options like 'step into' or 'step out' to see how your functions are operating.
Can you watch variables while debugging?
Yes! You can inspect the variables' state during execution and see how their values change. This is often referred to as variable watching.
Think of D.E.B.U.G - Debugging Essentials Bring Unique Gains; mastering these tools leads to smoother debugging.
Binary Search Debugging
🔒 Unlock Audio Lesson
Sign up and enroll to listen to this audio lesson
Let's explore a unique technique known as binary search debugging. Anyone familiar with it?
Isn't that where you comment out sections of code to isolate errors?
Exactly, Student_3! By methodically disabling parts of code, you can narrow down where the problem lies. This helps you hone in on specific areas faster.
How do you decide which part to disable?
Great question! Start by focusing on the most recently modified code. Remember, methodical approaches save time!
Use the phrase S.N.A.P. - Select, Nullify, Analyze, Proceed. It keeps you organized while debugging.
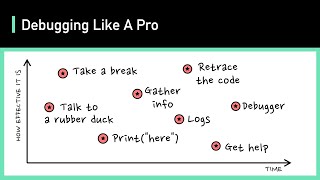
Rubber Duck Debugging
🔒 Unlock Audio Lesson
Sign up and enroll to listen to this audio lesson
Finally, let’s discuss rubber duck debugging. Who can explain what that is?
It's when you explain your problem to someone—or something else—to find a solution, right?
Spot on, Student_1! By vocalizing your thoughts, you often clarify your own understanding and can discover the problem yourself.
So, it’s kind of like teaching someone else?
Yes! Teaching or explaining solidifies your own knowledge. Remember to take a step away, articulate your thoughts, and watch how solutions can emerge!
Let's remember R.E.T. - Reflect, Explain, Troubleshoot. It's an efficient debugging strategy.
Introduction & Overview
Read summaries of the section's main ideas at different levels of detail.
Quick Overview
Standard
Debugging involves identifying and fixing bugs in software, and this section highlights several common techniques including print statements, logging frameworks, IDE debugging tools, and methods for narrowing down problem areas.
Detailed
Common Debugging Techniques
Debugging is an essential process that entails the systematized discovery, analysis, and correction of bugs in software applications. Effective debugging techniques can greatly enhance a developer's ability to identify issues quickly and correctly.
Common Techniques Include:
- Print Statements: Inserting System.out.println calls to share information about variable values at specific points in the program.
- Logging Frameworks: Utilizing tools like Log4j or SLF4J to manage log messages efficiently, making it easy to filter and analyze application behavior at runtime.
- IDE Debuggers: Most Integrated Development Environments (IDEs) come equipped with debugging tools that allow developers to set breakpoints, inspect variables, and step through code execution.
- Binary Search Debugging: Using a methodical approach to isolate issues by narrowing down the potential source of the bug through selective commenting or disabling code segments.
- Rubber Duck Debugging: Explaining the problem to an inanimate object, which can help developers think through their issues and clarify their thoughts.
This section not only enumerates these techniques but also emphasizes the importance of having a systematic approach to debugging, which improves software quality and reduces debugging time.
Youtube Videos


Key Concepts
-
Debugging: A systematic process for identifying and resolving software bugs.
-
Print Statements: Simple debugging techniques that output variable states and flow.
-
Logging Frameworks: Tools to manage logging output effectively.
-
IDE Debuggers: Integrated tools that enhance debugging efforts with breakpoints and watches.
-
Binary Search Debugging: A method of isolating problems through selective disabling of code.
-
Rubber Duck Debugging: A technique that involves explaining problems out loud to gain clarity.
Examples & Applications
Using a print statement to check if a variable is initialized correctly before it is used.
Logging errors in a framework like Log4j, which helps in filtering and analyzing error messages.
Using breakpoints in an IDE to pause execution and inspect current variable states.
Commenting out sections of code to isolate which part is causing an issue.
Using the rubber duck debugging approach to articulate the problem to a plush toy and discover a solution.
Memory Aids
Interactive tools to help you remember key concepts
Rhymes
When you're stuck and not knowing what's amiss, speak it out loud; it leads to the fix!
Stories
Imagine a programmer who talks to a rubber duck, explaining each line of code until the bug gives up.
Memory Tools
Remember S.N.A.P. for binary search: Select, Nullify, Analyze, Proceed!
Acronyms
Use R.E.T. - Reflect, Explain, Troubleshoot in rubber duck debugging.
Flash Cards
Glossary
- Debugging
The systematic process of detecting, analyzing, and fixing bugs or issues in software.
- Print Statements
Lines of code that output information about program variables and flow to the console.
- Logging Frameworks
Tools designed to help developers manage log messages and analysis in an efficient manner.
- IDE Debuggers
Integrated tools within Development Environments that help debug code with features like breakpoints.
- Binary Search Debugging
A method where developers systematically disable parts of code to isolate errors.
- Rubber Duck Debugging
Explaining a problem aloud, often to an inanimate object, to gain clarity and insight.
Reference links
Supplementary resources to enhance your learning experience.