
Debugging: Concepts and Techniques
Enroll to start learning
You’ve not yet enrolled in this course. Please enroll for free to listen to audio lessons, classroom podcasts and take practice test.
Interactive Audio Lesson
Listen to a student-teacher conversation explaining the topic in a relatable way.
What is Debugging?
🔒 Unlock Audio Lesson
Sign up and enroll to listen to this audio lesson

Today, we'll discuss debugging. Can anyone tell me what debugging is?

Isn't debugging when you fix bugs in your software?
Exactly! Debugging is about detecting, analyzing, and fixing issues in code. Think of it like a detective solving a mystery in your software.

What are some methods we can use for debugging?
Good question! We can use print statements, logging frameworks, IDE debuggers, and even a technique called rubber duck debugging where you explain your problem out loud. Would anyone like to explain rubber duck debugging further?

I think it’s when you explain your code to a rubber duck to help find issues?
That's right! It's actually very helpful. Let’s recap: debugging is systematic, and we can use various techniques to find and fix bugs.
Techniques of Debugging
🔒 Unlock Audio Lesson
Sign up and enroll to listen to this audio lesson

Now let’s delve deeper into debugging techniques. Who can name one?

Print statements?
Exactly! Print statements helped us understand the flow of the program. What about logging?
Logging captures detailed information about the software's execution, right?
Yes, logging frameworks like Log4j help us keep track of events in our software. Can anyone think of when we might prefer using logging over print statements?
When we want to maintain a record over time, instead of just getting immediate feedback from console outputs!
Great insight! Let's summarize: print statements, logging, IDE tools, binary search methods, and rubber duck debugging are all effective techniques for debugging.
Using IDEs for Debugging
🔒 Unlock Audio Lesson
Sign up and enroll to listen to this audio lesson
Now, let’s look at how we can utilize IDEs for debugging. What steps are involved?
First, you set breakpoints in the code.
Correct! A breakpoint allows us to pause execution. What’s next?
Run the code in debug mode to hit the breakpoints.
Exactly! Then we can use features like 'step over' or 'step into' to navigate through our code. Any other features you think are useful?
Watching variables helps see how their values change.
Yes! Evaluating expressions during a running program is valuable too. Remember, effective debugging is systematic and uses available tools wisely!
Best Practices in Debugging
🔒 Unlock Audio Lesson
Sign up and enroll to listen to this audio lesson
Let's wrap up our discussion with best practices in debugging. What should we keep in mind while debugging?
We should reproduce bugs consistently.
Exactly! Reproducing bugs helps in understanding them better. What else?
Using version control can help compare changes.
Great point! And log important events and exceptions. Always stay calm, and approach debugging systematically. Let’s summarize the best practices: reproduce bugs, use version control, log events, and don’t panic!
Introduction & Overview
Read summaries of the section's main ideas at different levels of detail.
Quick Overview
Standard
This section covers the essential techniques used in debugging, such as print statements, logging frameworks, and using IDE tools. The goal is to improve the software's reliability and efficiency by systematically addressing and resolving bugs.
Detailed
Debugging: Concepts and Techniques
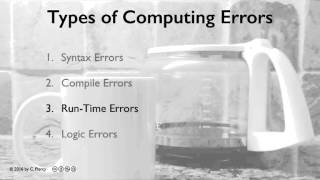
Debugging is a crucial software development process aimed at detecting, analyzing, and remedying bugs or flaws within a software application. Among the various techniques employed in debugging, the following are widely recognized:
- Print Statements: Simple yet effective, developers often insert System.out.println statements to trace the flow of execution and inspect variable states at runtime.
- Logging Frameworks: Tools like Log4j or SLF4J provide structured logging solutions that help capture detailed logs which can be analyzed later to understand application behavior and identify issues.
- IDE Debuggers: Integrated Development Environments (IDEs) like IntelliJ IDEA or Eclipse come equipped with debugging tools, allowing developers to set breakpoints, inspect variables, analyze call stacks, and evaluate expressions during the execution of the program.
- Binary Search: A methodical approach where debugging efforts focus on narrowing down potential error areas by testing segments of code in a divide-and-conquer manner.
- Rubber Duck Debugging: A technique where developers explain their code or problem aloud to an inanimate object (like a rubber duck) to clarify their thoughts and reveal potential issues.
Debugging not only enhances software quality but also equips developers with critical problem-solving skills essential for effective software development.
Youtube Videos


Audio Book
Dive deep into the subject with an immersive audiobook experience.
What is Debugging?
Chapter 1 of 2
🔒 Unlock Audio Chapter
Sign up and enroll to access the full audio experience
Chapter Content
Debugging is the systematic process of detecting, analyzing, and fixing bugs or issues in software.
Detailed Explanation
Debugging is essentially the process developers follow to find and resolve problems in their code. When a program doesn't behave as expected—maybe it crashes or produces incorrect output—debugging comes into play. It involves identifying where things went wrong, understanding why they went wrong, and then correcting the errors to improve the software's performance and reliability.
Examples & Analogies
Think of debugging like troubleshooting a car that's not running correctly. You might first identify that the engine won't start (detecting the bug), then figure out it’s because the battery is dead (analyzing), and finally, you replace the battery (fixing) so the car runs smoothly again.
Common Debugging Techniques
Chapter 2 of 2
🔒 Unlock Audio Chapter
Sign up and enroll to access the full audio experience
Chapter Content
• Print statements (e.g., System.out.println)
• Logging frameworks (e.g., Log4j, SLF4J)
• IDE Debuggers (breakpoints, watches, stack trace analysis)
• Binary search to narrow down problem areas
• Rubber duck debugging (explain problem aloud)
Detailed Explanation
There are various techniques used in debugging to help isolate and solve issues:
- Print Statements: By inserting print statements in the code, developers can see what's happening at specific points, which helps in revealing the state of variables.
- Logging Frameworks: These allow developers to log messages at various severity levels. This information is crucial for understanding application behavior over time without cluttering the code with print statements.
- IDE Debuggers: Integrated Development Environments (IDEs) provide powerful debugging tools. Breakpoints let you pause execution at certain lines, watches track variable values, and stack traces help understand the path your code took to get to an issue.
- Binary Search: This strategy involves systematically narrowing down the section of code that may contain the issue, similar to guessing a number in a range by halving the possible values each time.
- Rubber Duck Debugging: This unconventional technique involves explaining your code and the problem aloud, as if you were speaking to a rubber duck. This often helps clarify your thoughts and leads to discovering the solution.
Examples & Analogies
Imagine you're trying to fix a leak in your house. You could use a flashlight (print statements) to see where the water is coming from. You might also take notes of when exactly the leak happens (logging). If you decide to call a repair person (IDE debugger), they could pinpoint the issue by looking at the pipes (breakpoints) and see where the water is most concentrated (watches). If you have a friend help you by talking through your thoughts (rubber duck debugging), they might point out something you hadn't considered.
Key Concepts
-
Debugging: The process of identifying and fixing software issues.
-
Print Statements: A simple and direct method for debugging.
-
Logging Frameworks: Offer a comprehensive way to keep track of application execution.
-
IDE Debuggers: Tools within an IDE that facilitate in-depth debugging.
-
Rubber Duck Debugging: Explaining your code to an inanimate object for clarity.
Examples & Applications
Using a print statement to check variable values at certain points in your code.
Implementing Log4j to capture error messages and execution flow in your application.
Memory Aids
Interactive tools to help you remember key concepts
Rhymes
To debug, look at the flow, print and log, and let ideas grow.
Stories
Imagine you’re a detective trying to solve a mystery in your software. You use tools like magnifying glasses (IDEs) and notes (logs) to find clues.
Memory Tools
Remember the steps of debugging: 'P L R' - Print, Log, Resolve.
Acronyms
B.R.A.I.N. - Breakpoints, Reproduce, Analyze, Investigate, Nullify (fix the bugs).
Flash Cards
Glossary
- Debugging
The systematic process of detecting, analyzing, and fixing bugs or issues in software.
- Print Statements
A method to output the current state of a program to the console for debugging purposes.
- Logging Frameworks
Tools that provide structured logs to monitor software behavior and assist in debugging.
- IDE Debuggers
Built-in tools in development environments that allow developers to pause execution and inspect code.
- Rubber Duck Debugging
A technique where a developer explains their code or problems to an inanimate object to clarify their thoughts.
- Binary Search
A method of diagnosing issues by systematically narrowing down the area of suspected problems.
Reference links
Supplementary resources to enhance your learning experience.