
Experimental Setups in Fluid Measurement
Enroll to start learning
You’ve not yet enrolled in this course. Please enroll for free to listen to audio lessons, classroom podcasts and take practice test.
Interactive Audio Lesson
Listen to a student-teacher conversation explaining the topic in a relatable way.
Introduction to Orifice Meters
🔒 Unlock Audio Lesson
Sign up and enroll to listen to this audio lesson

Today, we're diving into the fascinating world of fluid measurement, starting with orifice meters. Can anyone explain what an orifice meter is used for?

Isn't it used to measure the flow rate of fluids in pipes?
Correct! An orifice meter measures flow rate by creating a pressure difference as fluid passes through an opening. Remember, it consists of a plate with a hole. We use Bernoulli's principle here to relate this pressure difference to fluid discharge.

What happens to the energy when fluid flows through an orifice?
Great question! As the fluid flows through, energy losses occur, which means the theoretical discharge calculated from Bernoulli’s equation will often exceed the actual discharge observed. Hence, we use the coefficient of discharge, often denoted as C, to adjust our calculations.

How do we determine that coefficient?
The coefficient of discharge is the ratio of actual discharge to the theoretical discharge. It gives valuable insight into the efficiency of our flow meter. Always keep in mind, C is not the same as the drag coefficient!

Can you repeat that definition?
Absolutely! The coefficient of discharge (C) is defined as the actual discharge divided by the theoretical discharge. Remember: C = Q_actual / Q_theoretical. Now, let’s summarize: orifice meters create a pressure difference and require a coefficient of discharge for accurate calculations.
Venturimeters Compared to Orifice Meters
🔒 Unlock Audio Lesson
Sign up and enroll to listen to this audio lesson

Now let's compare orifice meters to another device: venturimeters. Can anyone describe how a venturimeter differs?
A venturimeter has converging and diverging sections, right?
Exactly! The venturimeter encompasses both a converging zone to accelerate fluid flow and a diverging zone to allow recovery of pressure. This design minimizes energy losses compared to orifice meters.
Does that mean it would provide a more accurate measurement?
Yes! However, despite these design improvements, we still have to account for losses using the same coefficient of discharge and correction factors. So, energy losses exist in both devices but are more pronounced in orifice meters due to the abrupt area change.
What type of fluid flow affects our meter measurements?
Very pertinent question! Both meters can experience laminar and turbulent flow. In turbulent flow, we often need to compute kinetic energy correction factors, to ensure that we correctly account for the energy discrepancies due to non-uniform velocity distributions.
What do those kinetic energy correction factors look like mathematically?
For laminar flow, the correction factor alpha is typically around 2, while for turbulent flow, it varies from approximately 1.04 to 1.1. This factor modifies kinetic energy calculations based on average velocity. Let’s recap: venturimeters have converging and diverging zones, reducing energy losses relative to orifice meters and require correction factors for accurate fluid measurement.
Understanding Pressures: Static, Dynamic, and Stagnation
🔒 Unlock Audio Lesson
Sign up and enroll to listen to this audio lesson
Let’s move on to pressures. Why do we need to consider static, dynamic, and stagnation pressures in our measurements?
Do these pressures affect how we measure flow?
Absolutely! Static pressure acts on fluid at rest, dynamic pressure relates to fluid movement, and stagnation pressure is the sum of both. These pressures are crucial for using instruments like piezometers and pitot tubes effectively.
How do these relate to the energy gradient?
Good point! The energy gradient line reflects the total energy in terms of height, pressure, and kinetic energy across a streamline. The sum of static and dynamic pressures leads to stagnation pressure and it’s vital to visualize these elements to analyze the flow patterns accurately.
What’s the practical importance of understanding these pressures?
It helps engineers design systems like pipe networks or channel flows, ensuring they can predict the energy losses and flow behaviors accurately. Thus, we apply this understanding in real-world applications to optimize and control fluid transfer systems.
So, knowing these pressures really aids efficiency?
Exactly! Understanding and measuring static, dynamic, and stagnation pressures effectively leads to enhanced efficiency in fluid systems. To summarize, these various pressures intertwine in our measurements and are critical for fluid dynamic analysis.
Kinetic Energy Correction Factors
🔒 Unlock Audio Lesson
Sign up and enroll to listen to this audio lesson
Now, let's dive deeper into kinetic energy correction factors. Can anyone articulate why we need these in fluid measurements?
Is it due to non-uniform velocity distributions?
Excellent! In practical scenarios, the velocity across the cross-section isn’t uniform, thus using average velocity without correction leads to inaccurate energy computations. Kinetic energy correction factors help adjust for this discrepancy.
How do we calculate that factor?
Typically, you integrate the velocity distribution over the area of flow. A common formula for laminar flow gives you a correction factor of about 2, while turbulent flow ranges between 1.04 and 1.1.
What happens if we neglect these factors?
If you ignore these factors, your predicted kinetic energy will be significantly lower than the actual energy in the system causing miscalculations in flow rate and other critical parameters.
Are there any tools or software that help to account for these factors?
Yes, many engineering tools and fluid simulation software can incorporate these factors into models to give more accurate outcomes based on specific fluid dynamics. Let’s highlight: kinetic energy correction factors adjust for non-uniform velocity distributions ensuring accurate energy calculations.
Energy and Hydraulic Gradient Lines
🔒 Unlock Audio Lesson
Sign up and enroll to listen to this audio lesson
Finally, let’s discuss energy and hydraulic gradient lines. How might these concepts assist engineers in fluid measurement?
Do they show how energy moves through fluid systems as it flows?
Exactly! Energy gradient lines reflect the total energy level along a streamline, while hydraulic gradient lines represent pressure head and elevation. Visualizing both lines helps in understanding potential energy losses during flow.
Can you connect this with Bernoulli’s principles?
Certainly! Bernoulli's principles state that energy conservation in a flow should hold true; thus, these lines offer practical ways to visualize and quantify energy transfer between hydraulic and kinetic components.
Is it crucial for designing piping systems?
Absolutely! When engineers design piping systems, they refer to these lines to calculate changes in energy and pressure, ensuring the system operates efficiently under various flow conditions. To summarize: energy and hydraulic gradient lines are indispensable tools in fluid dynamics for evaluating energy transformations throughout systems.
Introduction & Overview
Read summaries of the section's main ideas at different levels of detail.
Quick Overview
Standard
This section analyzes experimental setups used in fluid measurement, emphasizing orifice meters and venturimeters while highlighting the need for correction factors, such as hydraulic and energy gradient lines, to account for energy losses in real fluid flow. It also covers definitions of pressures and how these concepts apply to practical fluid mechanics scenarios, including design considerations in piped fluid systems.
Detailed
This section explores the various experimental setups utilized in measuring fluid flow, focusing particularly on orifice meters and venturimeters. It explains the fundamental operations of these devices and how they incorporate the principles of the Bernoulli equation and mass conservation equations to compute fluid discharge. The section also addresses the critical concept of coefficient of discharge, which accounts for the discrepancies between theoretical and actual fluid discharge due to energy losses incurred during flow. The need for kinetic energy correction factors is discussed, particularly in varying velocity distributions across pipe cross-sections, alongside definitions of static, dynamic, and stagnation pressures. Further emphasis is placed on the representation of energy gradient lines and hydraulic gradient lines to understand energy transformations and losses in fluid systems. By incorporating correction factors and understanding pressure dynamics, fluid mechanics can better predict and manage fluid behavior in engineering applications.
Youtube Videos


Audio Book
Dive deep into the subject with an immersive audiobook experience.
Introduction to Experimental Setups
Chapter 1 of 4
🔒 Unlock Audio Chapter
Sign up and enroll to access the full audio experience
Chapter Content
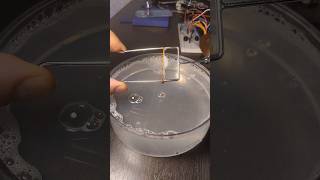
Now come back to where simple experimental setups, we generally do the measuring the flow in a pipe, either in a venturimeter or the orifice meter. The orifice meter is a small device, that means it will be a circle and there is a hole inside this. This is called the orifice. In case of the venturimeter you have a diverging zone and converging zone. But in case of orifice, we do not have a diverging and converging zone, only you have a reductions of the flow area that is what is the orifice meter.
Detailed Explanation
In this chunk, we learn about two common devices used for measuring fluid flow: the venturimeter and the orifice meter. The venturimeter features both a converging and diverging zone to measure flow rates effectively. On the other hand, the orifice meter is simpler, consisting of a flat plate with a circular hole. This design causes a reduction in flow area, which helps measure the pressure difference at various points in the fluid. This pressure difference is essential for calculating flow rates in various applications.
Examples & Analogies
Imagine you’re squeezing a garden hose with your thumb. By narrowing the flow area where your thumb rests, you can create a stronger stream of water. Similarly, orifice meters work by creating a controlled restriction in the flow to measure the resulting change in pressure and calculate the flow rate.
Bernoulli's Equations in Flow Measurement
Chapter 2 of 4
🔒 Unlock Audio Chapter
Sign up and enroll to access the full audio experience
Chapter Content
We can measure the pressure difference at two locations; one is at the fiber location where the cross section is really less and another is the off stream locations. That pressure difference and if you apply simple Bernoulli equations and the mass conservation equation, you can find out what will be the discharge passing through venture or orifice meters.
Detailed Explanation
Pressure differences at two different points in the pipe are crucial for understanding fluid dynamics. When fluid flows through an orifice meter or venturimeter, one can apply Bernoulli's equation—a principle of fluid mechanics that relates pressure, velocity, and elevation in a flowing fluid. By measuring the pressure at two locations: one upstream (standard flow) and one downstream (after passing through the constriction), you can determine the flow rate or discharge of the fluid using Bernoulli's principles.
Examples & Analogies
Think of how a water fountain works. When water is pushed through a small nozzle, it speeds up and shoots higher than when it exits through a wider base. Similarly, in fluid measurement, by measuring the pressure before and after narrowing the pipe with the orifice, we can calculate how much water (or fluid) is being discharged.
Understanding Energy Losses
Chapter 3 of 4
🔒 Unlock Audio Chapter
Sign up and enroll to access the full audio experience
Chapter Content
But as I said it earlier, that whenever flow goes through these venturimeter or orifice meter, there will be energy losses. Because of the energy losses, they will be difference between theoretical discharge and actual discharge. Since the Bernoulli equations what we applied, we do not consider the energy loss components.
Detailed Explanation
This section highlights that in real-world applications, energy losses occur during fluid flow due to factors like friction and turbulence. As a result, the theoretical discharge calculated using Bernoulli's equation (which assumes ideal conditions without losses) is typically higher than the actual discharge. These discrepancies underscore the importance of understanding and accounting for energy losses when designing and analyzing fluid systems.
Examples & Analogies
Think of going downhill on a bike. If the path is smooth, you can go much faster (like the theoretical discharge). But if the path is rough with bumps and friction (energy losses), you won’t be able to maintain that speed, and you’ll feel slower. Similarly, energy losses in fluid systems affect how we interpret flow measurements.
Coefficient of Discharge
Chapter 4 of 4
🔒 Unlock Audio Chapter
Sign up and enroll to access the full audio experience
Chapter Content
Whenever flow goes through these venturimeter or orifice meter, since there will be energy losses, the theoretical discharge computed using Bernoulli equations and the conservation equations will be higher than the actual discharge. That is the reason, we introduce the coefficient of discharge, that means the CD.
Detailed Explanation
The concept of the coefficient of discharge (CD) offers a way to relate the actual discharge (what we actually measure) to the theoretical discharge calculated through Bernoulli's equations. The CD compensates for energy losses, giving us a more accurate understanding of fluid flow in a system. Essentially, it is the ratio of the actual discharge to the theoretical discharge, and it acts as a correction factor that helps engineers assess system efficiency.
Examples & Analogies
Imagine a car’s fuel efficiency. A car's manual might state a theoretical MPG (miles per gallon), but real-world tests often show a different number due to multiple factors like terrain or load. Similarly, CD helps bridge the gap between theoretical calculations and practical measurements in fluid mechanics.
Key Concepts
-
Orifice Meter: A device that measures flow by creating a pressure difference.
-
Venturimeter: A flow measurement device that reduces energy losses through its design.
-
Coefficient of Discharge (C): Ratio of actual discharge to theoretical discharge accounting for losses.
-
Kinetic Energy Correction Factors (α): Adjustments made in calculations for non-uniform velocity.
-
Static Pressure: The pressure exerted by a static fluid.
-
Dynamic Pressure: The pressure due to fluid motion.
-
Stagnation Pressure: Sum of static and dynamic pressure when fluid velocity is zero.
-
Energy Gradient Line: Shows the total energy head along a fluid streamline.
-
Hydraulic Gradient Line: Represents pressure and elevation changes in a fluid system.
Examples & Applications
Orifice meters are commonly used in municipal water supply systems to monitor flow rates.
Venturimeters are often employed in industrial applications for accurate fluid measurement.
A pitot tube utilizes stagnation pressure to calculate fluid velocity based on the differences between static and dynamic pressures during airflow.
Memory Aids
Interactive tools to help you remember key concepts
Rhymes
To measure the flow, an orifice is the way, but energy losses are here to stay!
Stories
Imagine a smooth river bending through rocks. In one section, it speeds up; a brave explorer drops a pebble, measuring the splash. An orifice meter senses the change and shouts, 'Flow on!'
Memory Tools
C for Coefficient, E for Energy, P for Pressure: Remember this to keep fluid measurement in order.
Acronyms
C.D. stands for Coefficient of Discharge! Helps track flow reality.
Flash Cards
Glossary
- Orifice Meter
A device used to measure fluid flow rate by creating a pressure difference through an opening.
- Venturimeter
An instrument that measures flow rate by utilizing both converging and diverging sections to minimize energy losses.
- Coefficient of Discharge (C)
The ratio of the actual flow rate to the theoretical flow rate, accounting for energy losses.
- Kinetic Energy Correction Factor (α)
A correction factor applied to account for non-uniform velocity distributions in fluid flow.
- Static Pressure
The pressure exerted by a fluid at rest within a system.
- Dynamic Pressure
The pressure associated with the motion of a fluid, often calculated from the velocity of the fluid.
- Stagnation Pressure
The total pressure at a point where a fluid is brought to rest; it includes both static and dynamic components.
- Energy Gradient Line
A graphical representation of the total energy head at different points along a streamline.
- Hydraulic Gradient Line
A line that represents the hydraulic head in a fluid system, showing changes in pressure and elevation.
Reference links
Supplementary resources to enhance your learning experience.