
Friction Factors and Moody's Charts
Enroll to start learning
You’ve not yet enrolled in this course. Please enroll for free to listen to audio lessons, classroom podcasts and take practice test.
Interactive Audio Lesson
Listen to a student-teacher conversation explaining the topic in a relatable way.
Understanding Reynolds Number and Flow Types
🔒 Unlock Audio Lesson
Sign up and enroll to listen to this audio lesson

Today, we're going to start with Reynolds numbers. Can anyone tell me what a Reynolds number is, and why it's significant in fluid mechanics?

Is it a measure to predict whether the flow is laminar or turbulent?
Exactly! A Reynolds number helps us determine the flow regime. If it's below 2300, we have laminar flow, and if it's above 4000, it’s turbulent. Can anyone share what happens in between?

That's the transitional zone, right? Where the flow can fluctuate?
Correct! We define efficient flow characteristics based on these thresholds. Remember, lower Reynolds indicates smoother, more streamlined movement!
Let’s summarize: Reynolds numbers determine flow types with < 2300 as laminar, > 4000 as turbulent, and in between varies. Keep this in mind!
Friction Factors and Moody's Charts
🔒 Unlock Audio Lesson
Sign up and enroll to listen to this audio lesson

Now, let’s talk about friction factors and how we apply Moody's Charts. Can anyone recall what these charts help us with?

Do they provide a way to calculate friction factors based on Reynolds numbers?
That's right! Moody's Charts are incredibly useful for determining friction factors based on the flow type and relative roughness of pipes. What do you think happens to friction factors in laminar versus turbulent flows?

In laminar flow, it’s a straightforward calculation, but in turbulent flow, it varies with roughness and Reynolds numbers?
Exactly! In laminar flow, we can use the formula 64/Re, whereas turbulent flow sees more complexity with its dependency on roughness. Remember: smooth pipes make flows easier!
Key point to take home: Moody's Charts visually guide friction calculations. Understanding these factors leads to better design and efficiency.
Major and Minor Losses
🔒 Unlock Audio Lesson
Sign up and enroll to listen to this audio lesson
Let’s delve into energy losses. What can you guys tell me about major and minor losses in pipes?
Major losses occur mainly because of friction in the pipes, right?
And minor losses come from fittings like valves and elbows?
Correct on both counts! Major losses are indeed due to friction along the length of the pipe. Minor losses occur due to changes in flow conditions, like bends and fittings. Why is quantifying these losses important?
Because it impacts the efficiency and design of the entire system!
Exactly! Energy loss leads to higher costs and potentially inadequate system performance. Always consider major and minor losses in design.
Practical Applications of Bernoulli's Equation
🔒 Unlock Audio Lesson
Sign up and enroll to listen to this audio lesson
Now that we understand losses, who can explain how Bernoulli’s equation comes into play?
It’s used to calculate energy levels in flows and includes terms for pressure, velocity, and height!
Great! We often modify Bernoulli to account for energy losses. What’s our approach when analyzing pipeline systems?
We should include major and minor losses in the modified equation!
Correct! This helps in evaluating the actual energy potential throughout the system. Always keep losses in mind when using Bernoulli!
In summary, understanding energy losses allows for more accurate system designs that function effectively under practical conditions.
Introduction & Overview
Read summaries of the section's main ideas at different levels of detail.
Quick Overview
Standard
The section delves into the concepts of friction factors in pipe flow, highlighting the importance of Reynolds numbers and the role of Moody's Charts in determining friction factors for laminar and turbulent flow. It discusses transitions, major and minor losses, and the implications in practical applications, providing a comprehensive look at how these factors affect energy loss in fluid systems.
Detailed
Detailed Summary
This section discusses the concept of friction factors in fluid mechanics, particularly in relation to flow through pipes. Friction factors are crucial for understanding the energy losses due to friction as fluid moves through pipes, especially under different conditions dictated by flow regimes such as laminar, transitional, and turbulent flow.
Key Points Covered:
-
Reynolds Number and Flow Regimes: The section begins by explaining how the Reynolds number (
\(Re\)) is a dimensionless quantity used to predict flow regimes in pipes. A Reynolds number less than 2300 indicates laminar flow, while values greater than 4000 signify turbulent flow, with a range (2300-4000) indicating transitional flow. - Moody's Charts: The significance of Moody's Charts is highlighted. Developed from both experimental and historical data, these charts provide a graphical representation of friction factors across various Reynolds numbers and relative roughness conditions. The charts reveal how friction factors behave differently in laminar, transitional, and turbulent flows.
- Major and Minor Losses: The text covers the concept of major and minor losses during fluid flow. Major losses are primarily due to friction within the pipe, while minor losses occur from fittings, valves, and contractions/expansions in the pipe system.
- Application of Bernoulli's Equation: The relationship between energy losses and flow conditions is shown through the application of Bernoulli's equation, modifying it to account for pressure drops due to friction losses.
In summary, understanding friction factors and their computational methods is essential for engineers designing efficient fluid systems, optimizing pipe diameters, and managing energy losses.
Youtube Videos


![Turbulent Flow: Moody Chart [Fluid Mechanics #41]](https://img.youtube.com/vi/tISdp_394Bw/mqdefault.jpg)

Audio Book
Dive deep into the subject with an immersive audiobook experience.
Introduction to Moody's Chart
Chapter 1 of 5
🔒 Unlock Audio Chapter
Sign up and enroll to access the full audio experience
Chapter Content
Now let us go back to the Lewis Moody 1944 Princeton University, USA. What he has developed is from the experimental data. If you try to look it, he has not pulled out only his experimental data, but long back the data from others researchers. All the data he combined it for the developing this Moody's charts to compute friction factors, compute the friction factor, the flow through the pipes.
Detailed Explanation
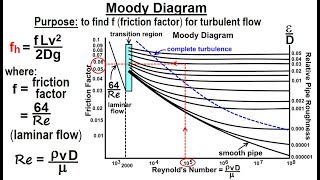
Moody's chart is a graphical representation created by Lewis Moody in 1944, which combines his experimental data with data from other researchers. It is essential for calculating friction factors in pipe flows. These friction factors are crucial for understanding how fluid flows through pipes and are affected by variables like Reynolds number and pipe roughness.
Examples & Analogies
Imagine you are following a recipe to bake a cake. You need to consider various factors such as oven temperature (analogous to Reynolds number) and the type of baking dish you use (similar to pipe roughness). Just as different baking methods can yield different results, the friction factors derived from Moody's chart help predict how smoothly fluids will flow through pipes.
Understanding Friction Factors
Chapter 2 of 5
🔒 Unlock Audio Chapter
Sign up and enroll to access the full audio experience
Chapter Content
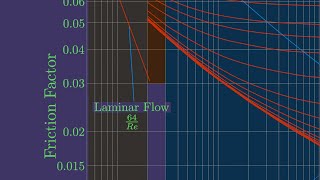
If you look at the friction factors, here we have a Reynolds numbers. The x axis is Reynolds numbers in logarithmic scales and the y axis we have the friction factors, which is normal scale. If you look at this part, what it is indicating for us the first condition is laminar flow. This is a laminar zone as I repeatedly showed that this is up to 2300. So the relationship between the friction factors and Reynolds numbers you have 64/Re.
Detailed Explanation
Moody's chart represents friction factors against Reynolds numbers. The Reynolds number is plotted on a logarithmic scale, indicating the flow regime of the fluid. If the Reynolds number is below 2300, the flow is considered laminar, and the friction factor can be calculated using the formula 64/Re, where 'Re' is the Reynolds number. Laminar flow is smooth and orderly, which affects how fluid interacts with surfaces.
Examples & Analogies
Consider how a car drives on different types of roads. On a smooth, well-paved road (laminar flow), the car moves smoothly without much resistance, similar to how fluid flows in a laminar state. On rough terrains (turbulent flow), there is more interference and struggle to maintain speed, mirroring how friction factors increase with turbulent flow.
Transition and Turbulent Flow
Chapter 3 of 5
🔒 Unlock Audio Chapter
Sign up and enroll to access the full audio experience
Chapter Content
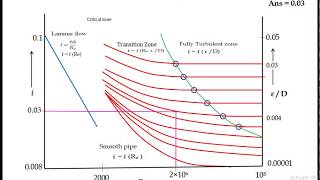
When you have a transition zone which is 2300 to 4000s in those regions, we cannot compute this friction factors because so fluctuation behaviors are there. We cannot compute it. If you compute it there will be a lot of erroneous will be there as the experimental data is showing it.
Detailed Explanation
The transition zone between Reynolds numbers of 2300 and 4000 is tricky because the behavior of flow fluctuates between laminar and turbulent conditions. In this range, predicting friction factors becomes unreliable due to these fluctuations, leading to potential errors in calculations.
Examples & Analogies
Think of a dancer moving between a graceful ballet on a smooth stage (laminar flow) and a lively hip-hop dance on a crowded street (turbulent flow). In the transition space, where their movements are uncertain, it becomes challenging to predict the next steps, just as it’s difficult to ascertain fluid behavior in the transition zone.
Rough Pipe Flow
Chapter 4 of 5
🔒 Unlock Audio Chapter
Sign up and enroll to access the full audio experience
Chapter Content
Then it can start from smooth pipe to rough pipe. That means, it can start with a relative roughness, which is . Each lines are representing for you the 0.05, 0.4. So this is the turbulent zone spot.
Detailed Explanation
As the flow moves to turbulent conditions, the friction factors are influenced not only by the Reynolds number but also by the relative roughness of the pipes. This means the roughness of the pipe's interior plays a significant role in how fluids travel through it; smoother pipes have less resistance than rougher pipes. After a certain point, the turbulent flow becomes more affected by roughness rather than the Reynolds number itself.
Examples & Analogies
Imagine water flowing through a garden hose with different inner surfaces: a smooth, glossy hose will let the water flow more freely than one with rough edges. This difference in surface quality dramatically changes the effort required to push the water through, just like how friction factors change with the roughness of pipe interiors.
Using the Moody Chart
Chapter 5 of 5
🔒 Unlock Audio Chapter
Sign up and enroll to access the full audio experience
Chapter Content
Once you the friction factors it is easy to compute energy losses. So once you know the energy losses then you can quantify it that what type of pipes we need it. What type of diameter pipe you need it, all we can link with the energy losses.
Detailed Explanation
With the friction factors determined from Moody's chart, calculating energy losses in a piping system becomes straightforward. By understanding these losses, engineers can make informed decisions about pipe materials, diameters, and layouts to ensure efficient fluid transport.
Examples & Analogies
Consider building a road for a community. Knowing how much traffic (energy losses) there will be helps engineers choose the appropriate road size and materials. Similarly, understanding friction factors allows engineers to design pipes that are efficient, minimizing energy loss and maximizing flow rate.
Key Concepts
-
Friction Factor: A measure of resistance encountered by fluid flow due to friction.
-
Moody's Charts: Graphical representation used to calculate friction factors based on flow conditions.
-
Reynolds Number: Indicates flow regimes; crucial for identifying laminar and turbulent flows.
-
Major Losses: Energy loss primarily due to friction within pipes.
-
Minor Losses: Additional energy losses from fittings and flow changes.
Examples & Applications
Example 1: Calculating friction factor for a water flow with Reynolds number of 3000 in a smooth pipe using Moody's chart.
Example 2: Determining energy losses in a piping system with multiple fittings (elbows and valves) and contrasting major losses due to pipe friction.
Memory Aids
Interactive tools to help you remember key concepts
Rhymes
Flow laminar, flow smooth, under two-three-hundred it's in the groove.
Stories
A river managed its flow with twists and turns; it learned to smooth out in times it churned. When calm, it flowed with ease, but when rough, it fought its glide; the winding paths taught it, how to carry its ride.
Memory Tools
Layer M to remember: Major losses = friction, Minor losses = fittings, Values are key!
Acronyms
FRICTION - Flow Resistance Is Calc'd Through Involvement Of Ohmic Nature.
Flash Cards
Glossary
- Friction Factor
A dimensionless number representing the resistance to flow in a pipe due to friction.
- Moody's Charts
Graphs that represent the relationship between Reynolds numbers and friction factors, used to compute pressure losses in pipe flow.
- Reynolds Number
A dimensionless quantity used to predict the flow regime, defined as the ratio of inertial forces to viscous forces.
- Major Losses
Energy losses due to friction along the length of a pipe.
- Minor Losses
Energy losses due to fittings, valves, and changes in diameter within a piping system.
Reference links
Supplementary resources to enhance your learning experience.