
Recap of Previous Lectures
Enroll to start learning
You’ve not yet enrolled in this course. Please enroll for free to listen to audio lessons, classroom podcasts and take practice test.
Interactive Audio Lesson
Listen to a student-teacher conversation explaining the topic in a relatable way.
Introduction to Energy Gradients
🔒 Unlock Audio Lesson
Sign up and enroll to listen to this audio lesson

Welcome, class! Today, we’ll discuss the importance of energy gradient lines and hydraulic gradient lines in fluid mechanics. Can anyone tell me what these lines represent in a pipe flow system?

I think they show how energy is lost or gained in the system?
Exactly! The energy gradient line indicates the total energy whereas the hydraulic gradient line shows the potential energy. These help us visualize energy losses throughout the system. Remember the acronym HEG—Hydraulic Energy Gradients.

What factors affect these energy gradients?
Great question! Factors like friction losses due to pipe roughness, bends, and fittings contribute to these losses. Can anyone name these losses?

Major and minor losses?
Correct! Major losses are due to friction, while minor losses arise from fittings. Let's summarize: HEG helps visualize where energy is lost.
Historical Significance of Experiments
🔒 Unlock Audio Lesson
Sign up and enroll to listen to this audio lesson

In our previous lesson, we reviewed Nikuradse's significant contributions to fluid mechanics through his experiments with rough pipes. Can someone explain what his findings were?
He conducted experiments to determine how roughness affects flow and friction.
Right, and what did he create that is still relevant today?
The Moody chart, which relates friction factor to Reynolds number?
Exactly! When we work with pipe flows, we often reference the Moody chart for design purposes. It’s an essential tool for engineers.

Why were his experiments so groundbreaking?
Nikuradse simplified complex behaviors of turbulent flows, paving the way for empirical equations. Remember, experiments translate to practical applications.
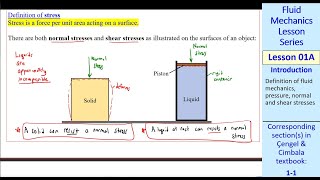
Understanding Wall Shear Stress
🔒 Unlock Audio Lesson
Sign up and enroll to listen to this audio lesson
Next, let's examine wall shear stress. How does it change in laminar vs turbulent flow?
I think wall shear stress is more pronounced in turbulent flow?
Exactly! In laminar flow, wall shear stress is uniform, while in turbulent flow, it varies. Can anyone explain why?
I guess it's because turbulent flow has eddies and fluctuations, creating more drag at the walls?
Great insight! Wall shear stress impacts energy losses, so it’s crucial in design calculations. Keep this in mind for our next exercise.
Non-Circular Conduits
🔒 Unlock Audio Lesson
Sign up and enroll to listen to this audio lesson
Lastly, let’s talk about non-circular conduits and how to compute equivalent diameters. Why is that important?
Because many real-world flows—like in channels—are non-circular?
Exactly! To analyze these flows correctly, we rely on hydraulic diameters. Can anyone explain how hydraulic diameter is calculated?
It’s the area divided by the wetted perimeter, right?
Correct! Always remember the formula for calculating equivalent diameters for different shapes. It’s essential when designing systems.
Introduction & Overview
Read summaries of the section's main ideas at different levels of detail.
Quick Overview
Standard
The recap emphasizes the significance of energy gradient and hydraulic gradient lines in understanding fluid flow through pipes, highlighting critical concepts such as energy losses and wall shear stress. The section connects the theoretical foundations to practical applications in noncircular conduits and turbulent flows.
Detailed
Recap of Previous Lectures
This section serves as a comprehensive overview of the previous fluid mechanics lectures, focusing on essential topics such as:
- Energy Gradient and Hydraulic Gradient Lines: These lines are crucial in identifying energy losses and gains in fluid systems, especially when analyzing pumps and pipe flow. The relationship between potential head, pressure head, and velocity head is also discussed.
- Major and Minor Losses: The concepts of major losses (e.g., friction in pipes) and minor losses (from bends or fittings) are crucial for accurate flow analyses.
- Nikuradse's Experiments: The historical context reveals the significance of Nikuradse's experiments on rough pipes, which helped establish relationships between friction factors and Reynolds numbers, leading to the development of the Moody chart.
- Noncircular Conduits: The section introduces hydraulic diameter concepts for noncircular flows, explaining how to compute equivalent diameters and the relevance in real-world scenarios.
The insights presented not only reinforce academic knowledge but also bridge understanding with practical implications for engineering.
Youtube Videos


Audio Book
Dive deep into the subject with an immersive audiobook experience.
Energy Gradient and Hydraulic Gradient
Chapter 1 of 4
🔒 Unlock Audio Chapter
Sign up and enroll to access the full audio experience
Chapter Content
Whenever you have any pipe flow components, like pumping systems and the reservoirs, please draw the energy gradient line and the hydraulic gradient line. Those two lines will indicate where the energy loss is happening and where the energy gain is occurring.
Detailed Explanation
In fluid mechanics, understanding the energy dynamics in pipes is essential. The energy gradient line represents the total energy along the flow direction, while the hydraulic gradient line indicates the pressure gradient. By drawing these lines, we can visualize how energy is lost due to friction or how energy is added by pumps. For instance, when a pump introduces energy into the pipe flow, the energy gradient line will show a rise due to the additional energy provided by the pump.
Examples & Analogies
Think of the energy gradient and hydraulic gradient like the height of a hill and the path down it. As you climb up the hill (the pump adding energy), you can see how steep the slope is (the hydraulic gradient) and where the path flattens out (indicating energy loss).
Understanding Major and Minor Losses
Chapter 2 of 4
🔒 Unlock Audio Chapter
Sign up and enroll to access the full audio experience
Chapter Content
There are major losses due to friction along the length of the pipe and minor losses occurring at bends, junctions, or sudden expansions or contractions in the piping system.
Detailed Explanation
Major losses in pipe flows typically occur due to friction and can be calculated using formulas that consider the length of the pipe, diameter, flow velocity, and the nature of the fluid. Minor losses, although often smaller than major losses, are crucial to account for as they can add up significantly in complex piping systems. Understanding both losses helps engineers design systems more effectively to ensure optimal flow.
Examples & Analogies
Imagine riding a bike down a road (the pipe) where the road is smooth (major loss) versus a road that has potholes and curves (minor losses). Smooth roads allow for faster riding, just like less friction in a pipe allows for smoother fluid flow.
Drawing Gradient Lines
Chapter 3 of 4
🔒 Unlock Audio Chapter
Sign up and enroll to access the full audio experience
Chapter Content
Whenever you solve a pipe flow problem, try to sketch an approximate energy gradient line and the hydraulic gradient line. Doing this helps identify how flow is occurring and where energy losses take place.
Detailed Explanation
Sketching these gradient lines is a crucial step in problem-solving for fluid mechanics. It visually represents the relationship between pressure, elevation, and flow velocity in the system. By understanding where these gradients coincide or diverge, one can identify potential issues such as excessive energy loss or inadequate pressure at critical points in the system.
Examples & Analogies
Think of this sketching process like mapping out a treasure hunt where each line indicates either how high or how low you are in search of treasure. In our case, the treasure is efficient flow with minimal losses.
Historical Experiment: Nikuradse's Work
Chapter 4 of 4
🔒 Unlock Audio Chapter
Sign up and enroll to access the full audio experience
Chapter Content
Nikuradse conducted experiments in the 1930s that provided insights into laminar, turbulent, and transitional flows by using pipes with sand grain roughness.
Detailed Explanation
Nikuradse's experiments were pioneering in portraying how rough surfaces affect fluid flow dynamics. By varying the roughness of pipe walls and observing the resulting flow behavior, he established critical relationships between flow conditions, roughness, and energy loss that are still applied today. This foundational work laid the groundwork for the Moody chart that engineers use to predict friction factors in pipe flow.
Examples & Analogies
Imagine feeling the difference between sliding your hand over a smooth surface versus a rough surface. The rough surface increases friction, much like how rough pipes impede fluid flow. Nikuradse's experiments made this relationship clear and quantifiable.
Key Concepts
-
Energy Gradient Line: A critical tool for visualizing energy changes in fluid systems.
-
Hydraulic Gradient Line: Shows potential energy and aids in understanding fluid behavior in pipes.
-
Nikuradse's Experiments: Pioneering work in establishing relationships between surface roughness and flow dynamics.
-
Wall Shear Stress: Essential for understanding energy losses due to friction at boundaries.
-
Hydraulic Diameter: A pivotal concept for analyzing non-circular conduits in engineering applications.
Examples & Applications
A practical example of calculating flow losses in a pipe system, using energy and hydraulic gradient lines.
Applying Nikuradse's findings to design a roughness model in contemporary pipe flow experiments.
Memory Aids
Interactive tools to help you remember key concepts
Rhymes
In pipes we measure heights and flows,/ Gradient lines show where energy goes!
Stories
Imagine a team of engineers exploring a river with twists and turns, examining how different surfaces change the flow they once thought was smooth. This is how Nikuradse discovered the effects of roughness!
Memory Tools
Remember the acronym HEG: Hydraulic Energy Gradients, guiding us through loss and gain in flows!
Acronyms
GAP
Gradient
Area
and Potential
key elements to remember in fluid dynamics.
Flash Cards
Glossary
- Energy Gradient Line
A line representing the total energy within a fluid system, indicating energy losses and gains.
- Hydraulic Gradient Line
A line representing the potential energy in a fluid system, calculated based on pressure and elevation.
- Nikuradse's Experiments
Groundbreaking experiments in the 1930s evaluating the impact of pipe roughness on flow behavior and friction.
- Wall Shear Stress
The shear stress exerted by a viscous fluid at the boundary of a flow system.
- Hydraulic Diameter
An effective diameter used for analyzing non-circular conduits, calculated as the area divided by the wetted perimeter.
Reference links
Supplementary resources to enhance your learning experience.