
Viscous Sublayer in High Reynolds Number Flows
Enroll to start learning
You’ve not yet enrolled in this course. Please enroll for free to listen to audio lessons, classroom podcasts and take practice test.
Interactive Audio Lesson
Listen to a student-teacher conversation explaining the topic in a relatable way.
Introduction to Viscous Sublayer
🔒 Unlock Audio Lesson
Sign up and enroll to listen to this audio lesson

Welcome, everyone! Today we are discussing the viscous sublayer in high Reynolds number flows. This layer is crucial for understanding turbulent flow dynamics. Can anyone tell me what they know about the concept of a viscous sublayer?

I think it’s a thin layer near the wall where the effects of viscosity are significant?
Correct! The viscous sublayer is that thin region where viscous effects dominate. In turbulent flow, this sublayer is important because it influences the shear stress and velocity distribution. Remember, we often think of it as a 'buffer' that separates the laminar and turbulent flow regions.

How does this relate to wall shear stress?
Great question! Wall shear stress is highest at the wall and decreases as you move away from it. The velocity gradient is steep in the viscous sublayer, meaning small changes in distance from the wall lead to significant changes in velocity.

Does this mean the flow velocity is not uniform across the pipe diameter?
Exactly! The velocity distribution in turbulent flow is more complex than in laminar flow, particularly near the wall. Today, we'll analyze how this affects turbulent flows as we discuss various Reynolds numbers.

That sounds interesting!
Let's summarize: The viscous sublayer is a key feature in turbulent flow, characterized by significant changes in shear stress and velocity near the wall. Understanding this helps us compute energy losses in pipe systems.
Key Experiments by Nikuradse
🔒 Unlock Audio Lesson
Sign up and enroll to listen to this audio lesson

Next, let’s talk about historical experiments by Nikuradse that established many foundational principles about pipe flow. What do you know about these experiments?
He used pipes with rough walls, right?
Correct! By using pipes with sand grains to create roughness, he observed how this affected the friction factor in turbulent flows. This led to the development of the Moody chart, which relates the friction factor to the Reynolds number and roughness.
What’s the significance of the Moody chart?
The Moody chart allows engineers to predict pressure losses in pipe flow systems based on the flow regime. This empirical tool is vital for designing efficient piping systems.
So it’s like a reference for engineers?
Exactly! It distills complex interactions into a useful format. This historic context is essential for understanding the viscous sublayer in practical applications.
How do we still use this today?
We use it to design systems in water supply, sewage treatment, and many other applications. Let's maintain this historical and practical perspective when studying fluid mechanics.
Velocity Profiles and Wall Shear Stress
🔒 Unlock Audio Lesson
Sign up and enroll to listen to this audio lesson
Now let's look into the velocity profiles in turbulent flows and their consequent wall shear stress. Why do you think these profiles matter?
They help us understand how the flow behaves near surfaces?
Precisely! The velocity profile shows how flow speed varies across the pipe's diameter. Near the wall, we observe a steep gradient in the viscous sublayer. This gradient affects shear stress, which we can quantify.
What happens when the Reynolds number is very high?
As Reynolds numbers increase and approach turbulent flow, the viscous sublayer becomes thinner, allowing more chaotic flow in the outer layer. However, the very wall adheres to the laminar behavior. This interaction is essential for accurate predictions.
Does this mean our calculations change at high Reynolds numbers?
Yes! The calculations for wall shear stress rely on the velocity distribution, which itself changes dramatically at higher Reynolds numbers. Understanding this allows us to predict energy losses effectively.
So this is really important for engineering applications!
Absolutely! Please remember, understanding how velocity profiles interact with the viscous sublayer is key to efficient fluid system design. Let's wrap up this session!
Introduction & Overview
Read summaries of the section's main ideas at different levels of detail.
Quick Overview
Standard
The section focuses on the dynamics of the viscous sublayer in high Reynolds number flows, explaining how this layer behaves in turbulent pipe flows. It includes insights on wall shear stress and velocity distribution, drawing upon historical experiments and modern applications to enhance comprehension.
Detailed
In this section, we explore the viscous sublayer that develops near the walls of conduits during high Reynolds number flows, particularly in turbulent conditions. The discussion encompasses key historical experiments, notably those conducted by Nikuradse, which established foundational relationships such as the Moody chart relating friction factors to Reynolds numbers. We analyze how flow behavior changes across varying Reynolds numbers and delve into the distribution of velocity and wall shear stress within the viscous sublayer, which is critical for accurately predicting energy losses in pipe flow systems. Additionally, the concept of hydraulic diameter for non-circular conduits is introduced, providing essential context for the application of these principles in engineering scenarios.
Youtube Videos


![[Fluid Dynamics: Boundary layer theory] Turbulent Boundary Layer](https://img.youtube.com/vi/3NV5n2bUu0g/mqdefault.jpg)
Audio Book
Dive deep into the subject with an immersive audiobook experience.
Understanding the Viscous Sublayer
Chapter 1 of 5
🔒 Unlock Audio Chapter
Sign up and enroll to access the full audio experience
Chapter Content
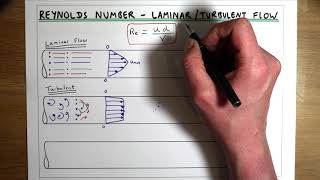
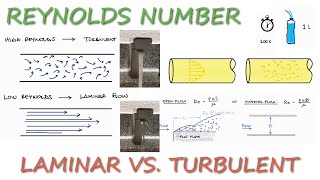
Now coming back to the higher Reynolds numbers turbulent flow, which is more than 3 million, the Reynolds number is more than 3 millions. In this case what it actually happens is I am not going more details. When you have the Reynolds numbers more than 3 millions, then there is certain zone of the velocity profile develops.
Detailed Explanation
In turbulent flow with high Reynolds numbers, specifically above 3 million, we observe a development of a specific zone in the velocity profile. This zone is known as the viscous sublayer. Within this thin layer, close to the wall, the fluid behaves similarly to a laminar flow, which means that the velocity of the fluid changes linearly with respect to the distance from the wall. This contrasts with the outer regions, which exhibit turbulent velocity profiles and behavior.
Examples & Analogies
Imagine a smooth, calm river flowing next to a rough, fast-flowing section. The calm section represents the viscous sublayer where water moves uniformly, while the fast-flowing, turbulent section represents the turbulent flow dynamics in the river. Just like how the water flows gently near the bank (like the viscous sublayer), the center of the river can rush wildly without concern for the riverbank.
Velocity Distribution in the Viscous Sublayer
Chapter 2 of 5
🔒 Unlock Audio Chapter
Sign up and enroll to access the full audio experience
Chapter Content
Like at the wall you can see there will be a flow which behave like the laminar flow, which behave like viscous sublayers. And the you go outer of zones you will see that will be a velocity profile will be develop it, which is not the linear relationship between.
Detailed Explanation
In the region very close to the wall, the flow is laminar, which allows for a linear relationship between the sheer stress and the velocity profile. As we move away from this wall, the flow becomes more complex and transitions away from linear behavior. The velocity distribution changes significantly, illustrating that the characteristics of fluid dynamics vary based on distance from the boundary in high Reynolds number flows.
Examples & Analogies
Think of a crowded dance floor. Those very close to the walls (the dancers near the edges) move at a more controlled pace, akin to the laminar flow. Conversely, dancers in the center (the turbulent flow) are moving chaotically, with much more variation in their movements. This comparison demonstrates how movement can appear orderly near boundaries while becoming chaotic farther away.
Profile Overlap in High Reynolds Number Flows
Chapter 3 of 5
🔒 Unlock Audio Chapter
Sign up and enroll to access the full audio experience
Chapter Content
But as go far away from the wall, you will have it where it will have a turbulent velocity profile zones, which experimentally established that change of reasons will happen as we will go from the wall.
Detailed Explanation
As we extend further from the wall, we encounter different zones in flow behavior characterized by turbulence. Beyond the viscous sublayer is a region where the flow becomes unstable and turbulent, resulting in a more complex velocity profile compared to what is found near the wall. This transition from laminar behavior near the wall to turbulent flow further away is a critical concept to understand in high Reynolds number systems.
Examples & Analogies
Imagine standing at the edge of a crowded amusement park ride (the wall). Close to the ride, everything is orderly—the line flows smoothly like laminar flow. As you step back into the park, you see groups of visitors darting every which way, resembling turbulent flow dynamics. The ride's vicinity offers a controlled flow, just as the viscous sublayer does with fluid dynamics.
Dimensional Analysis of Shear Stress
Chapter 4 of 5
🔒 Unlock Audio Chapter
Sign up and enroll to access the full audio experience
Chapter Content
Most of the times this type of things as I said it earlier we do a non-dimensional analysis and then we try to establish the relationship with dependent variable or independent variable.
Detailed Explanation
In fluid mechanics, especially in studies involving the viscous sublayer, engineers often utilize non-dimensional analysis. This technique allows them to normalize various physical quantities and derive relationships between wall shear stress, velocity distribution, and other fluid dynamics variables. By eliminating units from the equations, we can focus on the fundamental relationships that govern the phenomena.
Examples & Analogies
Consider preparing a recipe where you adjust quantities based on the number of servings. Instead of using specific grams or ounces for each ingredient, you convert everything into fractions of a whole (like 1/4 of a cup). This simplification allows you to easily adjust for any number of servings, much like how dimensional analysis helps streamline complex fluid dynamics into comprehensible relationships.
Friction Velocity and Wall Shear Stress Relationship
Chapter 5 of 5
🔒 Unlock Audio Chapter
Sign up and enroll to access the full audio experience
Chapter Content
Where, V = q/A. That is the reason is called empirical studies, the wall stress the relations with the average velocities and the kinematic viscosities and R value.
Detailed Explanation
The relationship between wall shear stress and average velocity can be modeled through empirical equations, where fluid properties such as kinematic viscosity play a significant role. The equation V = q/A defines the average velocity of the flow, establishing a basis from which we can derive wall shear stress values. It takes into account the cross-sectional area and flow rate, making it crucial for understanding how these parameters interact in high Reynolds number flows.
Examples & Analogies
Consider how a garden hose works. The flow rate (q) is the amount of water coming through the hose, and the area (A) is the cross-section of the hose. If you squeeze the hose, reducing the area, more pressure builds up at the wall of the hose, similar to how wall shear stress influences flow dynamics in a turbulent fluid. This analogy captures how controlling one variable directly influences another.
Key Concepts
-
Viscous Sublayer: The important thin layer in turbulent flow where viscosity plays a significant role in shear stress and velocity distribution.
-
Reynolds Number: A critical dimensionless number that helps predict flow behavior in pipes.
-
Wall Shear Stress: The shear stress acting on the wall due to fluid movement, significant for calculating energy losses.
-
Moody Chart: A practical tool to relate friction factors with flow conditions in pipes.
-
Hydraulic Diameter: Used for non-circular conduits, allowing engineers to apply circular flow equations effectively.
Examples & Applications
In turbulent flow through a circular pipe, the profile of velocity changes significantly near the wall, which can result in higher energy loss calculations if not properly accounted for.
The Moody chart provides a reference that enables engineers to compute the friction factor based on given Reynolds numbers and the relative roughness of the pipe.
Memory Aids
Interactive tools to help you remember key concepts
Rhymes
In a turbulent swirl, near the wall, the viscous sublayer's where we call; it helps us see, with forces that cling, how flow interacts, a marvelous thing!
Stories
Imagine a bustling river that flows smoothly at its center but slows down drastically the moment it brushes against the riverbank, where friction is felt most keenly. This slows the river, illustrating the viscous sublayer in action.
Memory Tools
To remember key properties of the viscous sublayer, use 'SHEAR': Stress near wall, High velocities, Energy loss, And Reynolds effects.
Acronyms
Remember 'VET' for viscous effects
Velocity
Edge flow
Turbulence.
Flash Cards
Glossary
- Viscous Sublayer
A thin layer near the wall of a conduit where viscous effects dominate in turbulent flows.
- Reynolds Number
A dimensionless number used to predict flow patterns in different fluid flow situations.
- Wall Shear Stress
The tangential force per unit area exerted by the fluid on the wall of a conduit.
- Moody Chart
A graphical representation that relates the friction factor for pipe flows to the Reynolds number and pipe roughness.
- Hydraulic Diameter
A dimension used to characterize non-circular conduits based on their cross-sectional flow area and wetted perimeter.
Reference links
Supplementary resources to enhance your learning experience.