
Wall Shear Stress Computation
Enroll to start learning
You’ve not yet enrolled in this course. Please enroll for free to listen to audio lessons, classroom podcasts and take practice test.
Interactive Audio Lesson
Listen to a student-teacher conversation explaining the topic in a relatable way.
Introduction to Wall Shear Stress
🔒 Unlock Audio Lesson
Sign up and enroll to listen to this audio lesson

Welcome, everyone! Today, we are focusing on wall shear stress, a key concept in fluid mechanics. Can anyone tell me why wall shear stress is important?

Isn't it related to how fluids exert force on the surfaces they flow over?
Exactly! Wall shear stress helps us understand the forces acting at the boundary of the fluid. It's crucial for designing pipes and systems where fluid flows. To remember this, think of the acronym 'WSS' which stands for Wall Shear Stress.

But how do we calculate it, especially in different types of pipes?
Good question! We will dive into the equations and methods for different scenarios, including circular and noncircular conduits.

Is the roughness of the pipe walls important too?
Absolutely! Roughness significantly impacts flow dynamics. For now, let's outline what we'll cover: empirical data from Nikuradse's experiments and hydraulic diameters in noncircular conduits.
In summary, wall shear stress is vital in understanding fluid behavior at pipe boundaries, especially as it relates to pipe design.
Nikuradse's Experiments
🔒 Unlock Audio Lesson
Sign up and enroll to listen to this audio lesson

Next, let's discuss Nikuradse's experiments conducted in the 1930s. Why do you think they were significant?

They probably set the foundation for our current understanding of turbulent flows, right?
Exactly! Nikuradse's work with rough pipes provided empirical relationships that help us analyze turbulent flow characteristics. Can anyone name one of those relationships?
The Moody chart?
Yes! The Moody chart is crucial for determining friction factors. It visually represents how roughness and Reynolds number affect friction in pipes. Remember, 'friction factors, flow rates, and the Moody chart' form a triangle of essential concepts.
So, if we have high roughness, we expect higher wall shear stress?
Correct! Increased roughness leads to greater friction losses. Let’s summarize: Nikuradse's experiments are foundational for understanding turbulent flow dynamics.
Hydraulic Diameter in Noncircular Conduits
🔒 Unlock Audio Lesson
Sign up and enroll to listen to this audio lesson
Now, let's turn to hydraulic diameter. Who can remind us what this means in the context of noncircular conduits?
Is it a way to calculate an 'equivalent diameter' for shapes that aren't circular?
Absolutely! Hydraulic diameter simplifies the analysis of flow in conduits by considering their area and wetted perimeter. For a rectangular conduit, the formula is derived from those two factors.
Why is the wetted perimeter important?
Great question! The wetted perimeter affects how much surface area the fluid interacts with, which impacts frictional forces. Remember the formula for hydraulic diameter: 'D_h = 4 * Area / Wetted Perimeter.'
Can we apply this to triangular conduits as well?
Yes, we can! And understanding the geometry helps us analyze different flows effectively. In summary, hydraulic diameter is essential for evaluating wall shear stress in various conduit shapes.
Reynolds Number and Flow Behavior
🔒 Unlock Audio Lesson
Sign up and enroll to listen to this audio lesson
Next, let’s examine the Reynolds number. Who can tell me what it represents?
It relates to the type of flow in a pipe, like whether it's laminar or turbulent.
Exactly! Low Reynolds numbers indicate laminar flow, while high values suggest turbulent behavior. Why is this distinction important for wall shear stress?
Because it changes how we calculate shear stress, right?
Correct! In laminar flow, it's predictable, but turbulent flow introduces complexities like flow fluctuations. To remember this, think 'Low Reynolds leads to Laminar, High Reynolds to Turbulent'.
So, turbulent flow has a more uneven velocity profile?
Yes, and understanding this helps predict shear stress behavior. Let's summarize: Reynolds number thresholds influence flow characteristics, affecting wall shear stress computations.
Practical Applications and Importance
🔒 Unlock Audio Lesson
Sign up and enroll to listen to this audio lesson
Finally, let’s discuss why calculating wall shear stress is crucial in engineering.
Is it related to the design of piping systems?
Absolutely! It helps engineers design systems that manage fluid flow efficiently. Do you think inaccurate shear stress calculations could cause problems?
Yes, it could lead to failures or inefficiencies, right?
Exactly! The potential for higher energy costs and system failures underlines the necessity for accurate calculations. Think of the acronym 'SHEAR' - 'Stress Helps Engineers Avoid Ruin!'
Got it! So, applying these concepts practically can improve our designs significantly.
Correct! In summary, wall shear stress is critical for effective engineering design in fluid systems.
Introduction & Overview
Read summaries of the section's main ideas at different levels of detail.
Quick Overview
Standard
In this section, we explore how wall shear stress is calculated in pipe flow, including the implications of roughness and Reynolds number. The section also touches on the significance of empirical experiments, specifically those conducted by Nikuradse, and how these empirical relationships are critical in determining shear stress in turbulent flow within both circular and noncircular conduits.
Detailed
Wall Shear Stress Computation
This section delves into the computation of wall shear stress in the context of fluid mechanics, particularly focusing on noncircular conduits and turbulent flows. At the beginning, the significance of understanding wall shear stress is emphasized, as it plays a critical role in evaluating fluid behavior inside conduits.
Key Highlights:
- Historical Perspective: The content refers to landmark experiments conducted by Nikuradse in the 1930s, which laid the groundwork for understanding turbulent flow and friction factors in rough pipes. These experiments involved the introduction of geometric roughness into smooth pipes and observing the effect on wall shear stress and flow characteristics.
- Wall Shear Stress in Noncircular Conduits: The concept of hydraulic diameter is introduced to facilitate the analysis of wall shear stress in noncircular systems. The section presents methods to compute hydraulic diameters based on the area and wetted perimeter of various shapes, such as rectangular and triangular conduits.
- Impact of Reynolds Number: The correlation between wall shear stress and Reynolds number is discussed, emphasizing how flow regime (laminar vs. turbulent) affects stress computations. The transition from laminar to turbulent flow introduces complexities in the velocity distribution and shear stress profiles.
- Practical Application: The text references the use of Moody’s diagram, which is instrumental in predicting friction factors based on flow conditions, providing a crucial tool for engineers in designing efficient piping systems.
Understanding these principles is vital for applications in civil engineering, particularly in designing piping networks and hydraulic systems efficiently.
Youtube Videos
![[CFD] y+ for Laminar Flow](https://img.youtube.com/vi/yfYr72Gc4S4/mqdefault.jpg)


![[CFD] How Fine should my CFD mesh be?](https://img.youtube.com/vi/60fDz2cVdy8/mqdefault.jpg)


Audio Book
Dive deep into the subject with an immersive audiobook experience.
Introduction to Wall Shear Stress
Chapter 1 of 4
🔒 Unlock Audio Chapter
Sign up and enroll to access the full audio experience
Chapter Content
If you look at this any of the pipe flow we can have a laminar flow, the turbulent flow or the transitional in between the laminar and the turbulent flow. What the experiment is conducted by the Nikuradse is that with having very simple concept that the pipe put it with a roughness, this equivalent roughness is from the sand grains. This figure is shown it with a zoomed with a 20 times.
Detailed Explanation
Wall shear stress refers to the frictional force acting on the wall of a conduit (like a pipe) due to the flow of fluid. When this fluid moves, it layers close to the wall experience different velocities, which can be laminar (smooth) or turbulent (chaotic) depending on factors like the pipe diameter and fluid speed. In 1930s, Nikuradse conducted crucial experiments to better understand how flow behaved in pipes with rough surfaces introduced by materials like sand grains. His work involved varying degrees of pipe roughness to observe how it affected wall shear stress.
Examples & Analogies
Imagine rubbing your hand along a smooth wall versus a rough brick surface. The smooth wall feels different because there's less friction (lower shear stress), while the rough wall creates more resistance against your hand's motion (higher shear stress). This is similar to how fluids experience different shear stresses based on the surface they flow over.
Impact of Reynolds Number on Flow Behavior
Chapter 2 of 4
🔒 Unlock Audio Chapter
Sign up and enroll to access the full audio experience
Chapter Content
The also we know very well the Reynolds numbers also control the flow behaviors. So that way to know it what is will be the wall stress the tau value, what could be the velocity distributions, what could be the energy losses when you have a pipe length of L with the informations about the roughness, informations about flow Reynolds numbers.
Detailed Explanation
The Reynolds number is a dimensionless quantity that helps predict flow patterns in different fluid flow situations. It is calculated based on medium speed, viscosity, and characteristic length (like diameter for pipes). When the Reynolds number is low, it indicates laminar flow, while a high value indicates turbulent flow. Understanding the Reynolds number helps in determining wall shear stress, velocity distribution within the pipe, and energy losses due to friction as fluid moves along a pipe of length L, factoring in roughness and flow characteristics.
Examples & Analogies
Think of riding a bicycle in calm weather versus a windy day. On a still day (similar to low Reynolds number), your ride is smooth (laminar flow), but on a windy day (high Reynolds number), the bike feels more unstable and hard to control (turbulent flow). The conditions around you impact how smoothly you can ride, much like how fluid behaves differently in pipes based on its Reynolds number.
Nikuradse's Experimental Setup
Chapter 3 of 4
🔒 Unlock Audio Chapter
Sign up and enroll to access the full audio experience
Chapter Content
If you look at this any of the pipe flow we can have a laminar flow, the turbulent flow or the transitional in between the laminar and the turbulent flow. What the experiment is conducted by the Nikuradse is that with having very simple concept that the pipe put it with a roughness, this equivalent roughness is from the sand grains. This figure is shown it with a zoomed with a 20 times. That means you can see there is quite random the sand grains are roughened it or put it in here such a way that it can create a roughness on the wall of the pipe.
Detailed Explanation
Nikuradse set up a series of experiments using pipes with controlled roughness by coating their interiors with sand grains. This method allowed him to examine different flow behaviors, specifically focusing on how pipe surface roughness impacted wall shear stress and energy loss. His findings provided crucial correlation between the friction factors of turbulent flow and parameters like roughness and Reynolds number, leading to the development of the Moody chart, which is still widely used today.
Examples & Analogies
Consider how driving on a bumpy gravel road versus a smooth asphalt road affects your car's speed. On gravel, the car experiences more resistance due to the rough surface, similar to how flow experiences friction in a rough pipe. Nikuradse’s experiments showed us how this resistance can vary, helping engineers design better systems.
Understanding Flow Profiles and Energy Losses
Chapter 4 of 4
🔒 Unlock Audio Chapter
Sign up and enroll to access the full audio experience
Chapter Content
Now if you look it that by conducting a series of experiments, by Nikuradse finally bring a the friction factors relations with the Reynolds numbers which is Moody chart and we have been using that for designing all this pipe flow networks for the industry.
Detailed Explanation
Through careful experimentation, Nikuradse established relationships between wall shear stress, velocity, and the pipe's roughness, resulting in what is known as the Moody chart. This chart illustrates how friction factors vary with different flow conditions, allowing engineers to design efficient pipe systems by anticipating energy losses based on known parameters like flow rate and pipe texture.
Examples & Analogies
You can think of this like shopping. If you know the price and tax rate (similar to friction factors), you can better estimate your total expense before checkout. Similarly, engineers can use the Moody chart to predict how much energy will be lost in a piping system before it is built.
Key Concepts
-
Wall Shear Stress: The force per unit area on surfaces due to fluid motion.
-
Hydraulic Diameter: A calculated diameter for noncircular conduits to simplify analysis.
-
Reynolds Number: A dimensionless number indicating flow type (laminar or turbulent).
-
Moody Chart: A visual tool for determining friction factors based on flow conditions.
Examples & Applications
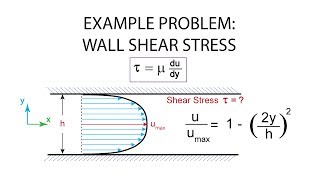
Example 1: Calculate the wall shear stress in a circular pipe with a known viscosity and flow rate.
Example 2: Use the Moody chart to find the friction factor for turbulent flow in a rough pipe.
Memory Aids
Interactive tools to help you remember key concepts
Rhymes
When fluid flows and stress shows, walls feel the force that no one knows.
Stories
Imagine a water pipe forcing liquid against its walls, the pressure builds, creating stress, just like a strong wind against an open window.
Memory Tools
To remember WSS, think - 'Walls Stress Surface'.
Acronyms
'HOD' for Hydraulic Diameter
'4 Area over Wetted perimeter'.
Flash Cards
Glossary
- Wall Shear Stress (WSS)
The tangential force per unit area exerted by fluid at the wall of a conduit.
- Hydraulic Diameter
An equivalent diameter for noncircular conduits, defined as 4 times the cross-sectional area divided by the wetted perimeter.
- Reynolds Number
A dimensionless number that predicts flow regimes by comparing inertial forces to viscous forces.
- Moody Chart
A graph that presents the relationship between friction factor, flow regime (laminar or turbulent), and Reynolds number.
- Turbulent Flow
A type of fluid flow characterized by chaotic and irregular fluid motion.
- Laminar Flow
A type of fluid flow in which fluid moves in parallel layers with minimal disruption.
Reference links
Supplementary resources to enhance your learning experience.