
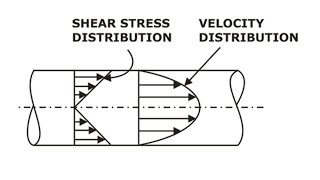
Velocity Distribution and Shear Stress
Enroll to start learning
You’ve not yet enrolled in this course. Please enroll for free to listen to audio lessons, classroom podcasts and take practice test.
Interactive Audio Lesson
Listen to a student-teacher conversation explaining the topic in a relatable way.
Introduction to Velocity Distribution
🔒 Unlock Audio Lesson
Sign up and enroll to listen to this audio lesson

Welcome class! Let's start by discussing *velocity distribution*. In pipe flow, why do you think the velocity isn't constant across the entire cross-section?

I think it varies because of friction with the pipe walls.
Exactly! This variation creates a velocity profile. In laminar flow, we see a parabolic profile, while turbulent flow tends to flatten out. Can anyone explain why?

In turbulent flow, the random motion of fluid particles averages out the velocities.
Great insight! This concept is essential when calculating shear stress. Remember, surface roughness also plays a vital role here.
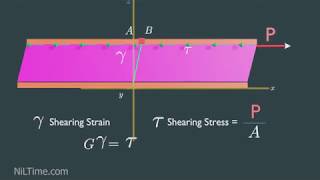
Wall Shear Stress
🔒 Unlock Audio Lesson
Sign up and enroll to listen to this audio lesson

Now let’s discuss *wall shear stress*. What do you think it contributes to in a fluid system?

Isn't it related to energy loss in the flow?
Correct! Wall shear stress represents frictional forces exerted by the fluid on the pipe walls, leading to energy loss. Can anyone tell me how we can express this mathematically?

I've seen it expressed with the formula τ = f * (ρ*V²).
That's right! Remember, different flow regimes will affect the value of 'f', leading us to use the Moody chart for friction factors.
Effect of Pipe Roughness
🔒 Unlock Audio Lesson
Sign up and enroll to listen to this audio lesson
Next, let’s explore *pipe roughness*. What role does it play in fluid flow?
Rough surfaces increase turbulence, which might increase energy loss, right?
Exactly! Surface roughness can change the flow regime and influence friction factors. This is why we rely on the Moody chart to find the appropriate friction factor based on roughness and Reynolds number.
How do we calculate the hydraulic diameter for non-circular conduits?
Great question! The hydraulic diameter is calculated using the wetted perimeter. This is crucial for using circular flow equations in non-circular scenarios. Remember this formula: D_h = 4 * Area / Wetted Perimeter.
Understanding Moody's Chart
🔒 Unlock Audio Lesson
Sign up and enroll to listen to this audio lesson
Let's wrap up with using the *Moody Chart*. Can someone explain its purpose?
It's for determining the friction factor based on Reynolds number and relative roughness.
Exactly! You plot the Reynolds number against the relative roughness to find the friction factor, which is crucial for calculating head loss in a system. Can anyone summarize what we've learned?
We've learned about how velocity distribution varies in pipes, how wall shear stress affects energy loss, the impact of roughness, and how to use the Moody chart!
Excellent summary! Remember these concepts as they form the backbone of fluid mechanics.
Introduction & Overview
Read summaries of the section's main ideas at different levels of detail.
Quick Overview
Standard
In this section, we explore how velocity distribution varies in pipe flows and the significance of wall shear stress. The content emphasizes the impact of pipe roughness on flow characteristics and introduces the Moody chart for understanding friction factors in different flow regimes.
Detailed
Velocity Distribution and Shear Stress
The discussion on velocity distribution and shear stress centers around the behaviors of fluid dynamics in both laminar and turbulent flow regimes, particularly within pipes. Historically significant experiments, including Nikuradse's influential work on rough pipes, established empirical relationships that are still fundamental today.
Key Points:
- Velocity Distribution:
- The velocity profile in a pipe varies according to flow conditions (laminar or turbulent) and the dimension of the pipe's cross-section. Laminar flow shows a parabolic distribution, while turbulent flow exhibits a flatter profile as Reynolds numbers increase.
- Wall Shear Stress:
- Wall shear stress is a critical factor affecting energy loss in a pipe. Empirical formulas help calculate shear stress based on factors such as flow velocity and hydraulic radius.
- Roughness and Friction Factors:
- The impact of surface roughness on flow, specifically the Moody chart, allows for the estimation of friction factors necessary for pipe flow analysis, illustrating relationships determined through empirical research.
- Hydraulic Diameter:
- For noncircular conduits, calculating hydraulic diameter uses wetted perimeter and is vital in flow calculations to ensure compatibility with circular flow equations.
Understanding these elements is crucial for analyzing fluid systems and designing efficient hydraulic systems.
Youtube Videos


Audio Book
Dive deep into the subject with an immersive audiobook experience.
Nikuradse's Experiments
Chapter 1 of 4
🔒 Unlock Audio Chapter
Sign up and enroll to access the full audio experience
Chapter Content
Now let us come back to very interesting experiments what it happened in 1930s... energy losses when you have a pipe length of L with the informations about the roughness, informations about flow Reynolds numbers.
Detailed Explanation
In the 1930s, Professor Nikuradse conducted significant experiments on pipe flow, which focused on how flow characteristics change due to pipe roughness. In these experiments, he introduced roughness to the inner surface of pipes using materials like sand grains. This roughness influences the velocity distribution of the fluid as it flows and leads to energy losses in the system. Nikuradse's work established fundamental relationships between roughness, flow type (laminar or turbulent), Reynolds number, wall shear stress, and friction factors, which are crucial for understanding and calculating fluid flow in pipes.
Examples & Analogies
Imagine walking on a smooth surface versus a rough surface. On a smooth surface, you can glide easily, while on a rough surface, you have to put in more energy to move forward due to friction. This analogy helps understand how pipe roughness impacts fluid flow – just like the roughness affects your movement, it disrupts the fluid's flow, causing energy losses.
Hydraulic Diameter
Chapter 2 of 4
🔒 Unlock Audio Chapter
Sign up and enroll to access the full audio experience
Chapter Content
Now let us come back to the noncircular conduit... hydraulic diameter as equal to the geometric diameters.
Detailed Explanation
In noncircular conduits, finding the hydraulic diameter is essential for analyzing fluid flow. The hydraulic diameter is calculated using the formula: diameter = 4 × (Area / Wetted Perimeter). The wet perimeter includes only the portion of the perimeter that is in contact with the fluid. For circular pipes fully submerged in fluid, the hydraulic diameter equals the physical diameter of the pipe. For pipes that are not fully submerged or that have a different shape (like rectangular or triangular), the hydraulic diameter gives a single representative value to use in calculations, simplifying the analysis of flow behavior.
Examples & Analogies
Think of a garden hose versus a square tube filled with water. The hydraulic diameter helps us understand how water flows through both shapes, allowing engineers to determine how much water can flow through them effectively, just like knowing how much water can flow through a narrow vs. a wide hose.
Turbulent Flow Characteristics
Chapter 3 of 4
🔒 Unlock Audio Chapter
Sign up and enroll to access the full audio experience
Chapter Content
Now if you look it that if you have the turbulent flow... will have uniform, not the maximum at the midpoint as you got in case of laminar flow.
Detailed Explanation
When examining turbulent flow through noncircular pipes, the wall shear stress distribution does not follow the same pattern as it does in laminar flow. In turbulent flow, the maximum wall shear stress occurs along the sides of the pipe edges rather than at the midpoint, as in laminar flow. This change is due to the chaotic nature of turbulent flow, which mixes fluid layers more efficiently and allows for a more uniform distribution of velocity at the wall. Understanding these differences is crucial for correctly calculating the forces and energy losses in different pipe shapes.
Examples & Analogies
Imagine mixing a fruit smoothie; when you blend different fruits, they mix chaotically, creating a uniform taste throughout the drink. Similarly, turbulent flow mixes the fluid more thoroughly, resulting in more even shear stress around the pipe wall compared to the orderly flow of a laminar smoothie where the fruits stay in distinct layers.
Wall Shear Stress in Turbulent Flow
Chapter 4 of 4
🔒 Unlock Audio Chapter
Sign up and enroll to access the full audio experience
Chapter Content
But when you look it what could be the shear stress that is what is the wall shear stress... giving the what could be the wall stress for a circular pipe.
Detailed Explanation
Wall shear stress is an important characteristic in fluid mechanics, especially in turbulent flow. It is the stress exerted by the fluid on the wall of the pipe. This stress can be quantified using empirical relationships derived from experimental data, considering factors such as average velocity and hydraulic diameter. The governing equations highlight the dependence of wall shear stress on variables like flow velocity and kinematic viscosity. Understanding these relationships allows engineers to predict how much force is exerted on the pipe walls, which is critical for design and material selection in piping systems.
Examples & Analogies
Consider rubbing your hand against a flowing river; the harder you try to keep your hand flat against the flow, the more force you feel pushing against it. Similarly, the wall shear stress is like that force. Engineers need to calculate this to ensure pipes can withstand the pressures and forces exerted by the flowing fluid without failure.
Key Concepts
-
Velocity Distribution: Refers to the variation of fluid velocities in a pipe, dictating flow characteristics.
-
Wall Shear Stress: The frictional stress exerted on the walls of a pipe by fluid flow, significant in energy loss calculations.
-
Moody Chart: A critical tool for determining friction factors across flow regimes based on Reynolds number and roughness.
-
Hydraulic Diameter: Essential for non-circular conduits, helps in generating equivalent flow conditions.
Examples & Applications
In a circular pipe with fully developed laminar flow, the velocity profile resembles a parabolic shape, while in turbulent flow the profile tends to be flatter.
Using the Moody chart, if the Reynolds number is 10,000 and relative roughness is 0.02, you can find the friction factor to compute energy losses.
Memory Aids
Interactive tools to help you remember key concepts
Rhymes
In a pipe, flow can glide, but shear stress won't hide. Round and rough, flows are tough, watch your losses, that's the stuff.
Stories
Imagine a grand water slide. At the top, the water flows smoothly, then hits rough patches that slow it down. The stronger the slide's bumps, the harder it is to glide!
Memory Tools
Use 'VSW-MD' to remember: Velocity - Shear - Wall - Moody - Diameter.
Acronyms
R.E.F. for Remembering
Roughness
Energy Loss
Friction Factors.
Flash Cards
Glossary
- Velocity Distribution
The variation of fluid velocity across the cross-section of a pipe.
- Wall Shear Stress
The shear stress acting on the wall of a pipe, resulting from fluid viscosity and flow velocity.
- Roughness
The texture of the pipe surface that affects flow characteristics, particularly in turbulent flow.
- Hydraulic Diameter
A diameter used for non-circular conduits, calculated as D_h = 4 * (Area/Wetted Perimeter).
- Moody Chart
A graphical representation that shows the relationship between the friction factor, Reynolds number, and relative roughness.
Reference links
Supplementary resources to enhance your learning experience.