
Roughness Effects in Pipe Flow
Enroll to start learning
You’ve not yet enrolled in this course. Please enroll for free to listen to audio lessons, classroom podcasts and take practice test.
Interactive Audio Lesson
Listen to a student-teacher conversation explaining the topic in a relatable way.
Introduction to Pipe Flow and Roughness
🔒 Unlock Audio Lesson
Sign up and enroll to listen to this audio lesson

Today, we will discuss how pipe surface roughness influences flow behavior. Can anyone explain what we mean by roughness in the context of fluid flow?

Isn't it about how uneven the pipe's surface is? Like how some pipes are smooth while others have bumps or textures?
Exactly! Surface roughness affects how the fluid interacts with the pipe walls. Rougher surfaces can lead to more turbulence, which we observe in the flow patterns. Who can tell me about the most famous experiment related to this?

Nikuradse's experiment, right? He used sand grains to create rough surfaces in pipes!
Correct! His work established critical relationships that we still use today, particularly in calculating friction factors. Remember: roughness impacts flow, and flow affects efficiency!
Reynolds Number and Flow Regimes
🔒 Unlock Audio Lesson
Sign up and enroll to listen to this audio lesson

Now, let’s connect surface roughness to Reynolds numbers. How does the Reynolds number influence the flow regime?

I think it helps to categorize the flow as laminar or turbulent! A low Reynolds number indicates laminar flow, right?
Absolutely! In laminar flow, the water moves in smooth layers, while in turbulent flow, it is chaotic. What happens to wall shear stress in these scenarios?

In laminar flow, wall shear stress is consistent, but in turbulent flow, it varies more due to the fluctuating velocities.
Great observation! Remember: in turbulent flow, energy losses can increase significantly due to the disturbances caused by roughness.
Hydraulic Diameter and Non-Circular Conduits
🔒 Unlock Audio Lesson
Sign up and enroll to listen to this audio lesson
Let's explore hydraulic diameters. Why do we need to calculate them, especially for non-circular conduits?
Because non-circular shapes have different wetted perimeters? It helps us understand how flow behaves in those shapes!
Exactly! The hydraulic diameter allows us to apply the same principles of fluid mechanics that we use for circular pipes. How do we calculate it?
It’s the area of flow divided by the wetted perimeter!
That's right! And don’t forget, knowing how to apply hydraulic diameters is essential for accurate flow analysis, especially with more complex systems.
Practical Applications and Modern Experiments
🔒 Unlock Audio Lesson
Sign up and enroll to listen to this audio lesson
Finally, let’s talk about modern experiments at IIT Guwahati. What are some current applications of studying roughness effects in fluid flow?
I think they relate to applications in water supply systems and sewage treatment! Understanding these factors makes systems more efficient.
Indeed! The implications are vast. Recent experiments allow us to quantify how vegetation and other natural elements impact flow in channels. Can anyone share how that might influence our designs?
Knowing flow behavior can help in designing better drainage systems, especially in areas with high vegetation density.
Fantastic! Remember: the principles we've discussed today apply not just to theoretical models, but to real-world engineering challenges.
Introduction & Overview
Read summaries of the section's main ideas at different levels of detail.
Quick Overview
Standard
The impact of pipe surface roughness on fluid flow characteristics is explored, highlighting significant experiments such as those by Nikuradse. The section discusses laminar and turbulent flow in relation to pipe roughness, the determination of hydraulic diameters, and applications of Moody's diagram for energy loss quantification in both circular and non-circular conduits.
Detailed
Detailed Summary
This section delves into the influence of surface roughness on flow behavior in pipes, outlining foundational experiments that established empirical relationships crucial for understanding fluid dynamics in engineering contexts. The content begins by revisiting key concepts from prior lectures, emphasizing the significance of energy and hydraulic gradient lines in characterizing fluid flow. Nikuradse’s experiments from the 1930s, involving roughened pipe surfaces, are highlighted for their revolutionary contributions to quantifying energy losses and determining velocity distributions in turbulent flow.
The discussion further explains the classification of flow as laminar or turbulent based on Reynolds numbers and roughness, citing empirical correlations to predict wall shear stress and friction factors via Moody’s diagram. Transitioning to non-circular conduits, the section introduces hydraulic diameters as a vital metric for understanding flow behavior and energy losses, along with differentiating characteristics of turbulent flows in various geometries. The section concludes with insights into modern applications of these principles in designing efficient piping systems across various engineering fields.
Youtube Videos


Audio Book
Dive deep into the subject with an immersive audiobook experience.
Introduction to Roughness Effects
Chapter 1 of 5
🔒 Unlock Audio Chapter
Sign up and enroll to access the full audio experience
Chapter Content
The experiments conducted in the 1930s helped simplify the understanding of energy losses, velocity distributions, and wall shear stress in pipe flow due to roughness.
Detailed Explanation
This introduction highlights the significance of historical experiments in fluid mechanics, particularly those that explored how wall roughness affects fluid flow in pipes. Rough surfaces, often represented by sand grains, create turbulence and increase resistance to flow, leading to energy losses. Understanding these effects was crucial for developing empirical models for predicting flow behavior in real-world applications.
Examples & Analogies
Imagine water flowing through a smooth slide versus a rocky creek. The slide allows water to flow smoothly and quickly, while the creek, with its rocks and roughness, impedes flow and creates turbulence, illustrating how surface roughness impacts movement.
Nikuradse's Experiment Setup
Chapter 2 of 5
🔒 Unlock Audio Chapter
Sign up and enroll to access the full audio experience
Chapter Content
Nikuradse conducted experiments with a simple setup involving a large water tank connected with a pump and a test section to measure velocities and energy losses in pipes with roughness.
Detailed Explanation
Nikuradse's experiment utilized a large water tank to create flow through pipes with artificially induced roughness. By measuring how much energy was lost due to wall friction, he was able to correlate the effects of different levels of roughness with varying flow conditions, ultimately providing a foundation for our understanding of turbulent flow in pipes.
Examples & Analogies
Think of waiting in line at a coffee shop. If all the espresso machines are running smoothly, the line moves quickly, but if one machine is broken or slow (like a rough pipe), the whole line backs up. In fluid mechanics, wall roughness has a similar effect on flow rates.
Frictions Factors and Reynolds Numbers
Chapter 3 of 5
🔒 Unlock Audio Chapter
Sign up and enroll to access the full audio experience
Chapter Content
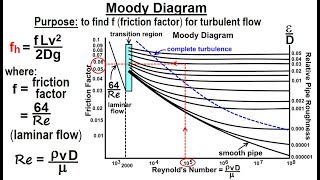
The relationship between friction factors, roughness, and Reynolds numbers leads to the Moody chart, a tool essential in pipe design for understanding flow resistance.
Detailed Explanation
In fluid dynamics, the friction factor is a dimensionless number that helps determine the pressure loss due to friction in a pipe. The Moody chart provides a graphical representation of the relationship between friction factors, Reynolds numbers, and relative roughness, which is crucial for engineers when designing pipe systems. It shows how rough surfaces at different flow rates can drastically change energy losses.
Examples & Analogies
Consider driving a car on a smooth highway versus a bumpy road. The amount of fuel you use will differ based on the friction between tires and the road surface, akin to the way pipe friction influences how much energy is needed to maintain flow.
Roughness in Noncircular Conduits
Chapter 4 of 5
🔒 Unlock Audio Chapter
Sign up and enroll to access the full audio experience
Chapter Content
When dealing with noncircular conduits, hydraulic diameters can be computed using the area and wetted perimeter, enabling the application of existing flow equations.
Detailed Explanation
For noncircular conduits, the hydraulic diameter serves as an equivalent measurement to facilitate calculations similarly to circular pipes. The hydraulic diameter is defined mathematically as four times the area of flow divided by the wetted perimeter, allowing engineers to apply flow equations regardless of the conduit shape.
Examples & Analogies
Think of water flowing in a rectangular channel versus a circular pipe. Both can transport water, but using the same equations requires accounting for their different shapes, much like adjusting a recipe based on the size of your pots and pans.
Wall Shear Stress and Velocity Distributions
Chapter 5 of 5
🔒 Unlock Audio Chapter
Sign up and enroll to access the full audio experience
Chapter Content
The wall shear stress and the distribution of velocity are significantly influenced by the flow regime: laminar or turbulent.
Detailed Explanation
In laminar flow, fluid moves in parallel layers with minimal disruption, resulting in predictable velocity profiles and wall shear stress distribution. In turbulent flow, energy is dissipated through chaotic fluctuations, complicating the relationship between velocity and shear stress, leading to more uniform distributions along the pipe walls. Understanding these distinctions is key for predicting and managing flow in various engineering applications.
Examples & Analogies
Imagine stirring honey versus stirring your morning coffee. The honey flows slowly and smoothly (laminar), while the coffee swirls in chaotic patterns (turbulent). This illustrates how fluid behavior changes dramatically under varying flow conditions.
Key Concepts
-
Surface Roughness: Influences flow characteristics and energy losses.
-
Reynolds Number: Determines whether the flow is laminar or turbulent.
-
Wall Shear Stress: Resistance encountered by fluid at pipe walls.
-
Hydraulic Diameter: Important for non-circular conduits to understand flow behavior.
-
Moody Diagram: Essential for determining flow friction factors.
Examples & Applications
Nikuradse's experiments illustrate how surface roughness affects both velocity distributions and friction factors in turbulent flow.
An example scenario could be calculating the hydraulic diameter for a rectangular channel half-filled with water.
Memory Aids
Interactive tools to help you remember key concepts
Rhymes
Rough pipes can make flows dull, energy losses can be full!
Stories
Imagine a racecar on a smooth track; it zips ahead. On a bumpy track, it stutters and slows down – this illustrates how roughness affects flow speed.
Memory Tools
R.E.W. stands for Roughness, Energy loss, and Wall shear stress - three key concepts to remember when studying pipe flow.
Acronyms
Remember 'M.R.C.'
Moody Diagram
Reynolds number
and Circularity for understanding pipe dynamics.
Flash Cards
Glossary
- Roughness
The texture or irregularity on a pipe surface that affects flow characteristics.
- Reynolds Number
A dimensionless number used to predict flow patterns in different fluid flow situations.
- Wall Shear Stress
The tangential force per unit area exerted by the fluid on the wall of a conduit.
- Hydraulic Diameter
A measure used to characterize the flow in non-circular conduits, defined as four times the cross-sectional area divided by the wetted perimeter.
- Moody Diagram
A graphical representation of the relationship between the Reynolds number and Darcy-Weisbach friction factor.
Reference links
Supplementary resources to enhance your learning experience.