
Velocity Profile for Turbulent Flow
Enroll to start learning
You’ve not yet enrolled in this course. Please enroll for free to listen to audio lessons, classroom podcasts and take practice test.
Interactive Audio Lesson
Listen to a student-teacher conversation explaining the topic in a relatable way.
Introduction to Turbulent Flow
🔒 Unlock Audio Lesson
Sign up and enroll to listen to this audio lesson

Today, we'll discuss the velocity profile in turbulent flow, which refers to how the speed of fluid varies across different layers in a pipe.

What causes fluid flow to become turbulent, as opposed to laminar?
Great question! Turbulent flow occurs when the Reynolds number exceeds a certain threshold, typically around 2000. This introduces random variations and eddies in flow.

So, what happens to the velocity profile in these turbulent conditions?
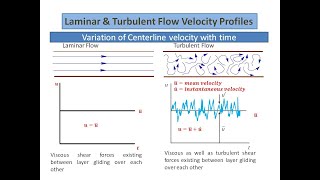
In turbulent flow, the velocity profile becomes flatter compared to laminar flow. We can visualize laminar flow as a parabola, while turbulent flow approaches a more uniform distribution.

Is there a way to quantify the relationship between flow and turbulence?
Absolutely! We use the Moody diagram, which relates friction factors to Reynolds numbers, helping us quantify energy losses in pipelines.

Can you summarize what we learned during this session?
Certainly! We explored how turbulent flow differs from laminar flow, specifically through velocity profiles and the role of Reynolds numbers. Next, we will dive deeper into wall shear stress.
Wall Shear Stress in Turbulent Flow
🔒 Unlock Audio Lesson
Sign up and enroll to listen to this audio lesson

Now let's examine wall shear stress, which is the frictional force between the fluid and the conduit walls. Why do you think it's important?
It must influence how much energy is lost due to friction, right?
Exactly! In turbulent flows, the wall shear stress is generally higher than in laminar cases. It's crucial for determining the energy loss across a pipe section.
How do we calculate that shear stress?
Good question! We can use empirical relations, such as the equation where shear stress at the wall is proportional to density, average velocity squared, and a factor based on hydraulic diameter.
Is this relation different for smooth and rough pipes?
Yes, indeed! The roughness of the pipe affects turbulence and consequently the wall shear stress.
To summarize, we studied how wall shear stress impacts energy losses in turbulent flows, emphasizing the role of pipe roughness.
Hydraulic Diameter in Noncircular Conduits
🔒 Unlock Audio Lesson
Sign up and enroll to listen to this audio lesson
Let's shift focus to hydraulic diameters in noncircular conduits. Why do you think we need to define hydraulic diameter?
Because noncircular shapes may not have a straightforward diameter like circles?
Exactly! Hydraulic diameter helps quantify flow characteristics in noncircular systems. It's defined via the area and wetted perimeter.
So does that mean we handle different conduit shapes differently?
Precisely! For instance, for a rectangular conduit, we compute both area and wetted perimeter to derive the hydraulic diameter to apply regular flow equations.
Can you summarize the steps for calculating hydraulic diameter?
Certainly! Calculate the flow area, determine the wetted perimeter, and then use the formula for hydraulic diameter. This allows us to analyze noncircular flows effectively.
Introduction & Overview
Read summaries of the section's main ideas at different levels of detail.
Quick Overview
Standard
The section explores the characteristics of velocity profiles in turbulent flow, emphasizing the work of Nikuradse, and introduces concepts like hydraulic diameter for noncircular conduits, wall shear stress, and the relevance of Reynolds numbers.
Detailed
In turbulent flow, the velocity profile and wall shear stress are crucial in understanding fluid behavior within conduits. This section examines the findings from significant historical experiments, such as those conducted by Nikuradse, which laid the foundation for velocity distribution laws in turbulent flow. Nikuradse identified that flow behaviors are dependent on both roughness factors and Reynolds numbers, leading to the development of Moody charts. The section also introduces hydraulic diameters for noncircular conduits and discusses variations in shear stress and velocity distribution for both laminar and turbulent regimes. Furthermore, it distinguishes between flow behaviors in turbulent conditions—specifically noting the uniformity of wall shear stress compared to laminar flow—and explains the emergence of velocity profiles that flatten out with increasing Reynolds numbers.
Youtube Videos


Audio Book
Dive deep into the subject with an immersive audiobook experience.
Introduction to Velocity Profiles
Chapter 1 of 5
🔒 Unlock Audio Chapter
Sign up and enroll to access the full audio experience
Chapter Content
Now coming back to the velocity profile, or the shear stress at the boundary. Here we divide into two zones as suggested by Nikuradse by conducting a series of experiment, finding out velocity profiles for the turbulent flow where you have the flow Reynolds number less than three millions okay.
Detailed Explanation
In fluid mechanics, understanding velocity profiles is essential for predicting how fluids behave under different conditions. Nikuradse's studies focused on turbulent flow, specifically flows with a Reynolds number below three million. The Reynolds number is a dimensionless value that helps to predict flow patterns in different fluid flow situations. This introduction sets the stage for a deeper exploration into how velocities vary in turbulent flow compared to laminar flow.
Examples & Analogies
Think of riding a bike. When you bike slowly (laminar flow), the air feels smooth and clean around you. But as you pedal faster (turbulent flow), the wind becomes chaotic, swaying you from side to side. Just like that, the way fluid flows changes drastically with speed, and that's what Nikuradse sought to understand.
Laminar vs. Turbulent Flow
Chapter 2 of 5
🔒 Unlock Audio Chapter
Sign up and enroll to access the full audio experience
Chapter Content
If you plot y by R okay and no doubt the velocity distribution for laminar flow this follows this ones. This is the laminar flow. But as increase the Reynolds numbers, okay, as increase the Reynolds number it goes off to these you can go to up to 3.24 order of million scales.
Detailed Explanation
Here, the text contrasts the velocity distribution between laminar and turbulent flows. Laminar flow is smooth and predictable, with a parabolic velocity profile. In turbulent flow, as the Reynolds number increases, the flow becomes more chaotic, and the velocity profile flattens. This change indicates that the fluid experiences greater mixing and more complex flow characteristics at higher velocities, which can be quantified through empirical relationships established by experiments.
Examples & Analogies
Imagine a smooth river (laminar flow) slowly flowing over rocks. The flow is even, and you can see the bottom clearly. Now, imagine heavy rainfall filling the river quickly, causing a rush of water that swirls and tumbles (turbulent flow). As the flow becomes faster, the water mixes up sediment, and you can't see clearly anymore. This illustrates how increased velocity leads to complex flow patterns.
Relationship of Velocity Distributions
Chapter 3 of 5
🔒 Unlock Audio Chapter
Sign up and enroll to access the full audio experience
Chapter Content
So to quantify the what could be the relationship for these type of velocity distribution, it establish a relationship with n varies with a Reynolds numbers. Its ranging from 6 to 10 for the Reynolds numbers from 4000 to the 3.2 million.
Detailed Explanation
This chunk describes how scientists developed a mathematical relationship to describe the velocity distributions in turbulent flows as a function of the Reynolds number. The parameter 'n', which varies between 6 and 10 within the defined Reynolds number range, plays a vital role in predicting how fluids will behave under different conditions. This relationship allows engineers to design systems more accurately, ensuring reliable and efficient fluid transport.
Examples & Analogies
Think of tuning a musical instrument. You adjust the strings based on the pitch (like adjusting the Reynolds number) to produce a harmonious sound (the velocity profile of fluid). Just like how the pitch varies with slight adjustments to the strings, the value of 'n' adjusts to different flow conditions in fluids, helping engineers find the right solutions for different challenges.
Wall Shear Stress in Turbulent Flow
Chapter 4 of 5
🔒 Unlock Audio Chapter
Sign up and enroll to access the full audio experience
Chapter Content
But when you look it what could be the shear stress that is what is the wall shear stress, shear stress at the wall of the pipe. That is what is also empirically established with the functions of wall stress, the average velocities and hydraulic radius and V.
Detailed Explanation
In turbulent flow, wall shear stress is a critical factor that affects how fluid interacts with pipe surfaces. It is determined empirically through tests that measure the relationship between average velocities and other parameters like hydraulic radius. Understanding this shear stress helps engineers predict how much energy will be lost due to friction when fluids flow through pipes, which is essential for designing effective piping systems.
Examples & Analogies
Consider how a riverbank erodes over time. The water flowing against the bank (similar to wall shear stress) can wash out soil and create new shapes in the landscape. Engineers study this effect to ensure that banks remain stable and that fluid systems function optimally without losing too much energy to friction.
Higher Reynolds Numbers and Velocity Profiles
Chapter 5 of 5
🔒 Unlock Audio Chapter
Sign up and enroll to access the full audio experience
Chapter Content
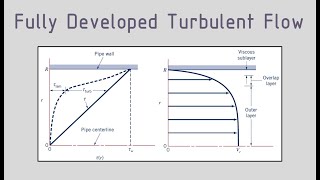
Now if you look it that when you go for higher Reynolds numbers turbulent flow, higher Reynolds number turbulent flow, which is more than 3 million, the Reynolds number is more than 3 millions. In this case what it actually happens is I am not going more details.
Detailed Explanation
When dealing with Reynolds numbers above 3 million, the flow characteristics start to deviate significantly from traditional turbulent behavior. At this point, the inner zones of flow can act almost like laminar flow, creating 'viscous sublayers' near the wall. This insight is crucial for understanding how fluids behave in high-velocity scenarios, as the relationships formed in lower Reynolds number flows may not apply.
Examples & Analogies
Think of a fast-moving train. When it's moving slowly, the air around it feels smooth, allowing the passengers to keep their hats on comfortably. But as it speeds up, a strong wind pulls at everything. In fluid dynamics, a similar phenomenon occurs when flow reaches high Reynolds numbers—surfaces that should reflect smooth behavior begin to act differently at high speeds, requiring new strategies to manage them.
Key Concepts
-
Turbulent Flow: Flow regime marked by chaotic changes in velocity and pressure.
-
Reynolds Number: A key parameter to determine flow regimes; critical for identifying whether flow is laminar or turbulent.
-
Moody Diagram: A chart illustrating the relationship between friction factor and Reynolds number, guiding pipe flow analysis.
-
Wall Shear Stress: A measure of the frictional force acting at the wall of the pipe due to fluid flow, affecting energy losses.
-
Hydraulic Diameter: Essential for analyzing noncircular conduits, allowing for consistent application of flow equations.
Examples & Applications
In a round pipe, the hydraulic diameter is equal to the pipe diameter. In contrast, for a rectangular channel, hydraulic diameter is defined as 4 times the area divided by the wetted perimeter.
When analyzing the Moody chart, a friction factor of 0.02 for a Reynolds number of 200,000 indicates that the flow is turbulent, but not excessively so—an essential detail for pipe design.
Memory Aids
Interactive tools to help you remember key concepts
Rhymes
When flow goes wild, it swirls and twirls, that's turbulent for all the water worlds.
Stories
Imagine a winding river, with eddies swirling. As you observe the water's chaotic dance, you understand turbulent flow.
Memory Tools
Roughly Rough Turbulence Leads to Eddies: RRTLE to remember turbulent flow characteristics.
Acronyms
R.E.W. - Reynolds, Energy losses, Wall Shear - key concepts to remember in turbulent flow.
Flash Cards
Glossary
- Turbulent Flow
A flow regime characterized by chaotic property changes, such as velocity, pressure, and vorticity.
- Reynolds Number
A dimensionless quantity used to predict flow patterns in different fluid flow situations.
- Moody Diagram
A graphical representation that shows the relationship between the friction factor, flow regime, and Reynolds number.
- Wall Shear Stress
The frictional force per unit area acting on the wall of a conduit due to fluid flow.
- Hydraulic Diameter
An equivalent diameter used in fluid flow analysis for noncircular conduits, defined based on the area and wetted perimeter.
Reference links
Supplementary resources to enhance your learning experience.