
Wall Shear Stress in Turbulent Flow
Enroll to start learning
You’ve not yet enrolled in this course. Please enroll for free to listen to audio lessons, classroom podcasts and take practice test.
Interactive Audio Lesson
Listen to a student-teacher conversation explaining the topic in a relatable way.
Introduction to Wall Shear Stress
🔒 Unlock Audio Lesson
Sign up and enroll to listen to this audio lesson

Today, we will start off with the fundamental concept of wall shear stress in turbulent flow. Wall shear stress is crucial as it directly impacts energy losses in fluid systems. Can anyone tell me why understanding wall shear stress is important?

It helps design efficient piping systems, right?
Exactly, that's correct! We calculate it to minimize losses in pressure and energy. One can think of wall shear stress as the friction caused by the fluid against the pipe walls.

How is it measured in practice?
Great question! Wall shear stress is usually measured using instruments that analyze velocity profiles near the wall, and it can also be computed using empirical formulas based on flow conditions.
Historical Perspective – Nikuradse's Experiments
🔒 Unlock Audio Lesson
Sign up and enroll to listen to this audio lesson

Now let’s delve into a pivotal historical figure in fluid mechanics, Professor Nikuradse. In the 1930s, he conducted experiments that highlighted the effects of wall roughness on turbulent flow. What do you think he discovered?

He found that roughness affects the flow characteristics significantly?
Exactly! His experiments led to the formulation of the Moody chart, which is used today to relate friction factors, Reynolds numbers, and roughness in pipe design.

And that was just for circular pipes, correct?
That's right, but later research advances allowed us to explore other geometries too. Let's keep that in mind as we move forward.
Hydraulic Diameters in Non-Circular Conduits
🔒 Unlock Audio Lesson
Sign up and enroll to listen to this audio lesson
Next, we'll discuss non-circular conduits. Who can explain what hydraulic diameter means?
Isn't it the diameter used to characterize flow in non-circular pipes?
Yes! The hydraulic diameter helps us to define equivalent flow for non-circular shapes. It incorporates both flow area and wetted perimeter into a single term.
So how is it calculated?
For example, for a rectangular conduit, it’s calculated using the formula for area and wetted perimeter. Let’s not forget: understanding hydraulic diameters is essential for accurate wall shear stress calculations.
Moody Chart and Friction Factors
🔒 Unlock Audio Lesson
Sign up and enroll to listen to this audio lesson
Now, let’s get practical. The Moody chart is a crucial tool engineers use. How does one utilize it when designing a system?
You can find the friction factor based on the Reynolds number and the roughness of the pipe?
Correct! This allows engineers to calculate expected losses in the system accurately. In summary, these relationships help create efficient and effective hydraulic designs.
Introduction & Overview
Read summaries of the section's main ideas at different levels of detail.
Quick Overview
Standard
The section provides an analysis of wall shear stress in turbulent fluid flows, highlighting key experiments, particularly by Nikuradse, and discussing how wall shear stress can vary based on flow conditions in different conduits. It covers concepts such as velocity distribution, hydraulic diameters, and the effects of roughness on shear stress.
Detailed
Wall Shear Stress in Turbulent Flow
This section explores the concept of wall shear stress in turbulent flow, emphasizing its importance in fluid mechanics. Wall shear stress is a key factor in understanding energy losses in pipe flow systems, and its measurement is critical for various engineering applications.
Key Points:
- Experiments by Nikuradse: In the 1930s, significant experiments were conducted to understand flow behavior and energy losses in pipes with rough structures. Nikuradse introduced the concept of using sand grains to create controlled roughness in pipes, which significantly influenced the empirical relationships we utilize today.
- Reynolds Numbers: The section covers how wall shear stress and velocity distributions depend on Reynolds numbers, indicating transitional flows between laminar and turbulent regimes.
- Measurements of Wall Stress: It describes methods to compute wall shear stress in various flow regimes and different conduit shapes, including circular and non-circular geometries.
- Hydraulic Diameters: For non-circular conduits, the section introduces the concept of hydraulic diameter, crucial for calculating relevant flow characteristics.
- Moody Chart: It also discusses the usage of the Moody chart, which relates friction factors to Reynolds numbers for different surface roughness, aiding in practical engineering applications.
Overall, understanding wall shear stress is vital in designing efficient fluid systems, particularly in civil and environmental engineering contexts.
Youtube Videos


Audio Book
Dive deep into the subject with an immersive audiobook experience.
Overview of Wall Shear Stress
Chapter 1 of 5
🔒 Unlock Audio Chapter
Sign up and enroll to access the full audio experience
Chapter Content
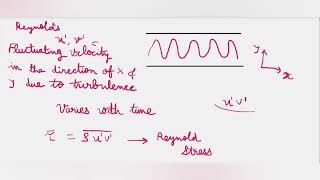
When considering turbulent flow in pipes, wall shear stress is a critical parameter that indicates the frictional forces acting on the pipe walls due to the motion of fluid.
Detailed Explanation
Wall shear stress refers to the stress exerted by fluid on the wall of a pipe or channel due to the viscous effects of fluid motion. This stress is vital in understanding how energy losses occur in turbulent flows. Essentially, as fluid moves through a pipe, it exerts a force on the pipe wall, and this force is quantitatively described as wall shear stress. In turbulent flow, this stress is generally non-uniform due to fluctuations in fluid velocity and direction.
Examples & Analogies
Imagine sliding your hand along a surface; the harder you press, the greater the resistance you feel. Similarly, as fluid flows over the pipe walls, the interaction creates friction, leading to wall shear stress. In kitchens, when you use a whisk to beat eggs, the resistance you feel from the eggs is akin to the shear stress against the wall of a pipe where fluid is moving.
Nikuradse's Experimental Setup
Chapter 2 of 5
🔒 Unlock Audio Chapter
Sign up and enroll to access the full audio experience
Chapter Content
Nikuradse conducted experiments in the 1930s using pipes with rough surfaces, made equivalent roughness from sand grains, to determine the relationship between wall shear stress, velocity distribution, and energy losses in turbulent flows.
Detailed Explanation
Nikuradse's experiments involved creating controlled roughness in pipes, which allowed researchers to observe how increased surface roughness affects flow patterns and wall shear stress. By measuring the velocity of fluid flow through pipes of known roughness, he established crucial empirical relationships between wall shear stress and the Reynolds number (a dimensionless quantity representing the flow regime). This foundational work led to the creation of the Moody chart, which helps engineers understand friction factors based on the type of flow and surface roughness.
Examples & Analogies
Think of sliding a book across a table: if the table is smooth, it glides easily. However, if the surface is covered with sandpaper (like rough pipes), it drags and creates more friction. Nikuradse's experiments took this concept and applied it to fluid motion, allowing scientists to predict how fluids behave in real-world scenarios.
Understanding Reynolds Number's Role
Chapter 3 of 5
🔒 Unlock Audio Chapter
Sign up and enroll to access the full audio experience
Chapter Content
Reynolds number determines flow behavior; low values indicate laminar flow while high values signify turbulence. Experiments show that as Reynolds number increases, the distribution of velocity and wall shear stress changes significantly.
Detailed Explanation
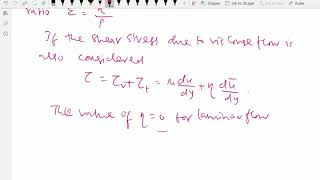
The Reynolds number is a dimensionless quantity that helps predict the flow regime of fluid. For Reynolds numbers less than approximately 2000, flow is typically laminar, which means it moves in parallel layers with minimal mixing. As the Reynolds number increases beyond this point, flow becomes turbulent, characterized by chaotic and irregular fluid motion. This change significantly alters how wall shear stress is distributed across the pipe wall; in turbulent flows, the velocity profile becomes flatter and more uniform as opposed to the parabolic profile found in laminar flow.
Examples & Analogies
Picture a smooth river flow: at low speeds, it glides gently, much like laminar flow. Increase the water's speed, and it churns and creates waves, similar to turbulent flow. The Reynolds number measures how 'wild' the river gets and helps engineers model pipes and channels for various fluids accordingly.
Velocity Profiles and Shear Stress in Turbulent Flow
Chapter 4 of 5
🔒 Unlock Audio Chapter
Sign up and enroll to access the full audio experience
Chapter Content
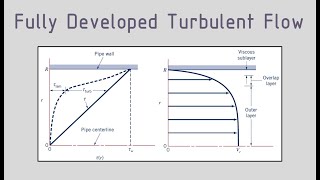
In turbulent flow, wall shear stress is compared against different velocity profiles. The distribution is more uniform along the pipe wall compared to laminar flow, where maximum shear stress is concentrated at midpoints of the sides.
Detailed Explanation
Understanding the velocity profile of turbulent flow is crucial for engineers. In turbulent conditions, the velocity across the pipe is less influenced by the wall shear stress compared to laminar flow. Instead of having a peak at the center and tapering off, as seen in laminar flow, turbulent flow tends to exhibit a more uniform velocity across the cross-section of the pipe. This uniformity results in different wall shear stress distributions, which can be critical for calculating energy losses in piping systems.
Examples & Analogies
Consider a crowded highway where cars (representing fluid) move at different speeds. In light traffic (laminar flow), cars follow a smooth, organized line with few changes in pace. In heavy, chaotic traffic (turbulent flow), the cars drive relatively uniformly across all lanes regardless of the increasing and chaotic differences in speed between them. This analogy reflects how turbulent fluid flow behaves differently from laminar flow.
Empirical Relationships Derived from Experiments
Chapter 5 of 5
🔒 Unlock Audio Chapter
Sign up and enroll to access the full audio experience
Chapter Content
The wall shear stress has been empirically derived from experimental data using relationships grounded in the flow's average velocity and properties, allowing for practical applications in engineering.
Detailed Explanation
Researchers have been able to create empirical formulas that relate wall shear stress to average flows in pipes based on experimental findings. This means that instead of needing complex simulations for every pipe scenario, engineers can leverage these formulas to make quick approximations about how much shear stress will occur at the walls, depending on the average velocity and the physical properties of the fluid. These relationships are essential for designing efficient piping systems in various engineering applications.
Examples & Analogies
Think of a chef measuring ingredients for a recipe. By using established proportions from previous cookbooks (empirical relationships), the chef can quickly know how much each ingredient will affect the final dish's taste. Similarly, engineers use established relationships found from experiments to predict flow behavior without starting from scratch each time.
Key Concepts
-
Wall Shear Stress: The force per area exerted by the fluid at the wall.
-
Turbulent Flow: A flow regime characterized by chaotic property changes.
-
Hydraulic Diameter: A measure used for non-circular conduits.
-
Moody Chart: A chart that links friction losses to Reynolds numbers and relative roughness.
Examples & Applications
Example of a circular pipe with known roughness and Reynolds number illustrating how to use the Moody chart to calculate friction factor.
Example of a rectangular channel flow calculating wall shear stress using hydraulic diameter.
Memory Aids
Interactive tools to help you remember key concepts
Rhymes
In turbulent flow, wall stress does grow, as roughness increases, energy does flow.
Stories
Imagine a race between water and friction; the rougher the path, the slower the water moves, causing energy losses—a constant battle in fluid flow.
Memory Tools
Remember 'RHEM' for wall shear: Reynolds, Hydraulic diameter, Energy, Moody chart.
Acronyms
Friction Factors and Reynolds Energy are what the Moody chart will yield - 'FREM' to keep them in mind.
Flash Cards
Glossary
- Wall Shear Stress
The tangential force per unit area exerted by a fluid at the boundary of a conduit.
- Reynolds Number
A dimensionless number used to predict flow patterns in different fluid flow situations.
- Moody Chart
A graphical representation that relates the friction factor to the Reynolds number for different types of flow.
- Hydraulic Diameter
A characteristic length used to analyze non-circular conduits, calculated using flow area and wetted perimeter.
Reference links
Supplementary resources to enhance your learning experience.