
Evidence for the Quantized Electronic Energy Levels: Atomic Spectra
Enroll to start learning
You’ve not yet enrolled in this course. Please enroll for free to listen to audio lessons, classroom podcasts and take practice test.
Interactive Audio Lesson
Listen to a student-teacher conversation explaining the topic in a relatable way.
Introduction to Atomic Spectra
🔒 Unlock Audio Lesson
Sign up and enroll to listen to this audio lesson

Today, we're diving into atomic spectra and its role in illustrating quantized electronic energy levels. Can anyone tell me what happens when white light passes through a prism?

It spreads into different colors!
Exactly! This phenomenon shows that light consists of various wavelengths. When elements absorb energy, do they emit light at all wavelengths?

No, they emit at specific wavelengths, right?
Correct! This emitted light forms an emission spectrum unique to each element. This uniqueness is what we refer to as the atomic spectra. Let’s remember: different colors indicate different energies. Who can summarize what quantization means?

It means that energy levels are restricted to specific values.
Well said! That's a key concept. Now, how is this quantization observed?

Through the distinct lines in the emission spectra of elements.
Perfect! Let’s move on to how we can use these spectral lines for identification.
Emission and Absorption Spectra
🔒 Unlock Audio Lesson
Sign up and enroll to listen to this audio lesson

Let's discuss what happens when atoms absorb photons and then re-emit energy. What can we observe in terms of emission and absorption spectra?
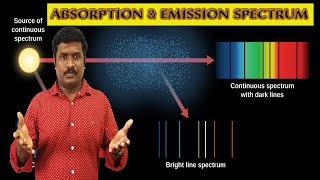
Emission spectra show bright lines on a dark background, while absorption spectra show dark lines in a bright background.
Exactly! The dark lines represent wavelengths where electrons absorbed energy and moved to higher energy states. Can someone give me an example of this in action?
An example could be how we identify elements using their emission spectra.
Correct! Every element's spectral fingerprint can determine its identity based on the lines present. These transitions are quantized, as we see in the hydrogen spectrum. Let's check our understanding: what does this tell us about electron positions?
Electrons occupy fixed energy levels and can jump between them.
Exactly! Now, let’s summarize. The emission spectrum is produced when an electron transitions to a lower level, releasing energy, while the absorption spectrum occurs when it moves to a higher level and absorbs energy.
Understanding the Hydrogen Spectrum
🔒 Unlock Audio Lesson
Sign up and enroll to listen to this audio lesson
Now, let’s focus on hydrogen. Can you name the series of lines we observe in its spectrum?
The Balmer series for visible light?
Yes! The Balmer series appears when electrons fall to n=2, and we can use an empirical formula to describe their wavelengths. What about the Lyman series?
It occurs when electrons drop to n=1 and is in the ultraviolet region.
Great! These series illustrate how energy quantization leads to observable phenomena in the form of light. Reflecting on what we learned, summarize why scientists use atomic spectra.
To identify and analyze elements based on their unique emission and absorption lines!
Exactly! Spectroscopy is fundamental in atomic structure understanding, enhancing our awareness of matter at a fundamental level.
Introduction & Overview
Read summaries of the section's main ideas at different levels of detail.
Quick Overview
Standard
The section outlines how the emission and absorption of light by atoms result in atomic spectra, showcasing distinct wavelengths. It explains the significance of quantization in energy levels, especially with reference to the hydrogen atom's spectral lines, highlighting the unique identification of elements through their spectral fingerprints.
Detailed
Evidence for the Quantized Electronic Energy Levels: Atomic Spectra
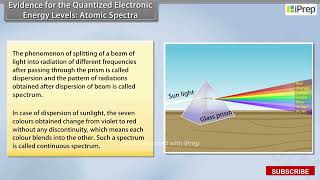
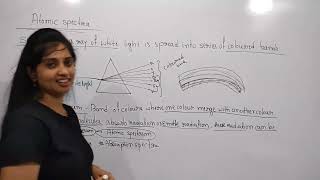
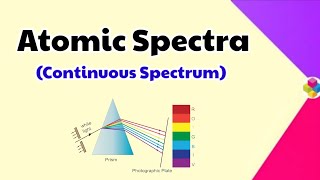
The concept of quantized electronic energy levels is crucial in understanding atomic spectra. When white light passes through a prism, it disperses into a spectrum, showing that light not only consists of various wavelengths but can also interact with matter. This interaction enables atoms to absorb energy and subsequently emit radiation at specific wavelengths. The emitted light constitutes an emission spectrum, distinct for each element.
Emission and Absorption Spectra
The emitted spectrum arises when excited atoms return to more stable, lower energy states. Each element has unique energy differences that lead to specific spectral lines. Conversely, an absorption spectrum captures the wavelengths of light absorbed by electrons transitioning to higher energy levels, leaving dark lines against a bright continuous spectrum. Thus, atomic spectra serve as fingerprints for elements, enabling identification based on their unique spectral lines.
The Hydrogen Spectrum
When examining hydrogen, the simplest atom, electric discharge through gaseous hydrogen leads to the emission of light at discrete frequencies. The Balmer series of visible lines in hydrogen's spectrum can be described by empirical formulas, suggesting quantized transitions between specific energy levels. Overall, the quantization of electronic energy levels is evidenced by line spectra, which are integral to the structure and behavior of atoms.
Youtube Videos

Audio Book
Dive deep into the subject with an immersive audiobook experience.
Understanding Light and Spectra
Chapter 1 of 5
🔒 Unlock Audio Chapter
Sign up and enroll to access the full audio experience
Chapter Content
The speed of light depends upon the nature of the medium through which it passes. As a result, the beam of light is deviated or refracted from its original path as it passes from one medium to another. It is observed that when a ray of white light is passed through a prism, the wave with shorter wavelength bends more than the one with a longer wavelength. Since ordinary white light consists of waves with all the wavelengths in the visible range, a ray of white light is spread out into a series of coloured bands called spectrum. The light of red colour which has longest wavelength is deviated the least while the violet light, which has shortest wavelength is deviated the most.
Detailed Explanation
When light travels through different mediums, like air to glass, it changes speed and bends, a phenomenon called refraction. White light, which contains all the colors of the spectrum, when passed through a prism, separates into various colors, creating a rainbow sequence where red light bends the least and violet the most. This bending helps scientists link the energy of light to its wavelength, with shorter wavelengths having more energy.
Examples & Analogies
Think of when you drop a straight stick in water; the stick appears broken or bent at the surface due to light bending. Similarly, when light passes through a prism, it 'breaks' into colors, much like how the stick appears to break at the water's edge.
Emission and Absorption Spectra
Chapter 2 of 5
🔒 Unlock Audio Chapter
Sign up and enroll to access the full audio experience
Chapter Content
The spectrum of radiation emitted by a substance that has absorbed energy is called an emission spectrum. Atoms, molecules or ions that have absorbed radiation are said to be “excited.” To produce an emission spectrum, energy is supplied to a sample by heating it or irradiating it and the wavelength (or frequency) of the radiation emitted, as the sample gives up the absorbed energy, is recorded.
Detailed Explanation
When substances absorb energy, they enter an excited state. To see this, you can heat a gas until it glows—it emits light at specific wavelengths, forming an emission spectrum. Conversely, an absorption spectrum shows dark lines where energy at certain wavelengths is absorbed, leaving gaps in the continuous spectrum. Each element emits and absorbs light at specific wavelengths, acting like a unique fingerprint for identification.
Examples & Analogies
Imagine a candle in a dark room. If you light it (adding energy), it glows (emission). If you look at the candle flame through colored glasses, some colors may appear dim or missing (absorption)—these phenomena help us identify elements in distant stars!
Line Spectra and Atomic Identification
Chapter 3 of 5
🔒 Unlock Audio Chapter
Sign up and enroll to access the full audio experience
Chapter Content
Line spectra are of great interest in the study of electronic structure. Each element has a unique line emission spectrum. The characteristic lines in atomic spectra can be used in chemical analysis to identify unknown atoms in the same way as fingerprints are used to identify people.
Detailed Explanation
Line spectra consist of specific wavelengths of light emitted by atoms, appearing as bright lines on a dark background. Each element emits a unique pattern of these lines—just like fingerprints, this helps scientists identify elements in unknown samples. For instance, helium was discovered in the sun by analyzing its line spectrum.
Examples & Analogies
Think of it like a musical instrument playing different notes; each element 'plays' its specific 'note' of light when excited. Scientists can listen for these 'notes' to identify the elements present, just as a music conductor tells which instruments are playing.
The Hydrogen Spectrum
Chapter 4 of 5
🔒 Unlock Audio Chapter
Sign up and enroll to access the full audio experience
Chapter Content
When an electric discharge is passed through gaseous hydrogen, the H2 molecules dissociate and the energetically excited hydrogen atoms produced emit electromagnetic radiation of discrete frequencies. The hydrogen spectrum consists of several series of lines named after their discoverers.
Detailed Explanation
In gaseous hydrogen, when energy is applied, the H2 molecules break apart, and individual hydrogen atoms can emit light at certain frequencies after becoming excited. These emitted light frequencies correspond to specific colors seen when a prism is used, resulting in a spectrum with distinct lines—Balmer, Lyman, and others based on the energy transitions of the electrons within the hydrogen atoms.
Examples & Analogies
Imagine hitting a tuning fork produces a specific note. If you strike different forks, they emit different notes. Hydrogen atoms do the same with light; depending on how much energy they gain, they can emit different colors of light corresponding to specific frequencies.
Quantization of Energy Levels
Chapter 5 of 5
🔒 Unlock Audio Chapter
Sign up and enroll to access the full audio experience
Chapter Content
The series of lines described in the hydrogen spectrum can be mathematically expressed with specific equations that the frequencies relate to the energy differences in electron transitions.
Detailed Explanation
The energies of transitions from one electron level to another in hydrogen can be predicted mathematically, meaning that transitions of electrons between defined energy levels result in the emission of light at specific frequencies. This connects the concept of quantized energy levels to observable phenomena in atomic spectra.
Examples & Analogies
Think of a ladder; each step represents a specific energy level. An electron can 'jump' between the steps but can't be between them. When it jumps down, it releases energy as light—similar to how jumping down a step from a certain height releases sound.
Key Concepts
-
Atomic Spectrum: A spectrum that represents distinct lines corresponding to specific wavelengths of emitted or absorbed light.
-
Quantized Energy Levels: Electrons occupy energy levels that are restricted to specific values.
-
Unique Spectral Fingerprint: Each element emits or absorbs light at distinct wavelengths, acting as a fingerprint.
-
Balmer and Lyman Series: Series of spectral lines corresponding to electronic transitions in hydrogen.
-
Spectroscopy: The study of the interaction of light with matter to provide insight into atomic structure.
Examples & Applications
The emission spectrum of hydrogen shows distinct lines that can be matched to known wavelengths, allowing identification of the element.
When light passes through a gas, certain wavelengths are absorbed, leaving dark lines in an absorption spectrum, revealing the elements present.
Memory Aids
Interactive tools to help you remember key concepts
Rhymes
In atoms where electrons soar, they leap in levels, ever more. From dark to light, they make their mark, in spectral lines, a glowing spark.
Stories
Imagine a party where everyone has a specific dance floor to dance on — each dancer represents an electron, dancing only on their unique floor, causing music (light) to be played that matches their moves (energy levels).
Memory Tools
A.B. (Atomic Band): A stands for Absorption (where lines disappear), B stands for Bright Emission (where lines appear).
Acronyms
S.P.E.C.T.R.U.M — Specific Patterns Emitted by Changing Temperature and Radiative Unstable Materials.
Flash Cards
Glossary
- Quantization
The restriction of energy levels to discrete values.
- Emission Spectrum
The spectrum of radiation emitted by a substance that has absorbed energy.
- Absorption Spectrum
The spectrum showing dark lines on a bright background corresponding to wavelengths absorbed by atoms.
- Balmer Series
The series of lines in hydrogen's emission spectrum that correspond to transitions to the n=2 energy level.
- Lyman Series
The series of lines in hydrogen’s emission spectrum that corresponds to transitions to the n=1 energy level.
Reference links
Supplementary resources to enhance your learning experience.