
Explanation of Line Spectrum of Hydrogen
Enroll to start learning
You’ve not yet enrolled in this course. Please enroll for free to listen to audio lessons, classroom podcasts and take practice test.
Interactive Audio Lesson
Listen to a student-teacher conversation explaining the topic in a relatable way.
Introduction to Line Spectrum
🔒 Unlock Audio Lesson
Sign up and enroll to listen to this audio lesson

Today, we will explore the line spectrum of hydrogen. To start, what do we mean by a line spectrum?

Isn't it the spectrum that contains distinct lines instead of a continuous range of colors?
Exactly! Line spectra result from energy transitions in atoms. In hydrogen, these lines correspond to specific wavelengths of light emitted or absorbed when electrons change energy levels. Can anyone tell me what concept allows us to understand these energy levels?

I think it has something to do with Bohr's model?
Yes! Bohr's model describes quantized energy states in hydrogen. When we talk about electrons moving between these orbits, we can say that energy is absorbed or emitted. Can you guess what happens when an electron absorbs energy?

It moves to a higher energy level, right?
Right! This transition produces the specific lines we see in the spectrum. Remember: absorption leads to higher energy states, while emission occurs when an electron falls back down.
Bohr's Model of Hydrogen
🔒 Unlock Audio Lesson
Sign up and enroll to listen to this audio lesson

Now, let’s dive deeper into Bohr's model. Why is it significant in explaining the hydrogen spectrum?

It helps us understand that the electron's energy belongs to discrete levels, not a continuous range.
Exactly! The energies are quantized, which means electrons can only occupy certain orbits. This leads us to the equation for energy changes: \( \Delta E = E_f - E_i \). What do you think this change in energy signifies?
It shows the energy difference when an electron transitions between orbits!
That's right! Understanding this helps us relate the energy changes to the frequency of light emitted or absorbed. Can someone tell me how we use Planck's equation here?
"We use \( E = h
Rydberg Formula
🔒 Unlock Audio Lesson
Sign up and enroll to listen to this audio lesson
Let’s talk about Rydberg’s formula, which allows us to calculate the wavelengths from transitions in hydrogen. Who can explain the general form of this formula?
It relates the wavelengths to the integers that represent the energy levels, right?
Spot on! It’s written as \( \nu = R_H \left( \frac{1}{{n_1}^2} - \frac{1}{{n_2}^2} \right) \). Why do you think Rydberg's formula works so effectively?
Because it incorporates the transitions between different energy levels in the hydrogen atom!
Exactly! Each series corresponds to specific transitions such as the Balmer series, which is visible. Can someone summarize how we can find the wavelengths using this formula?
We substitute the energy levels for the initial and final states to calculate the frequency, which we can then convert to wavelength.
Perfect summary! This mathematical representation is essential in understanding how the spectrum is constructed.
Significance of Hydrogen Spectrum
🔒 Unlock Audio Lesson
Sign up and enroll to listen to this audio lesson
In our last discussion, let’s consider the significance of the hydrogen spectrum in quantum physics. Why do we consider hydrogen so important?
It’s the simplest atom, making it easier to study and understand the foundational concepts of atomic structure!
Exactly! Its line spectrum has been crucial for developing quantum mechanics. How does it connect with more complex atoms?
We can use what we learn from hydrogen to make predictions about the transition in heavier elements.
That's right! The principles we derive from hydrogen lead to better comprehension of atomic behavior generally, even in much more complex systems. Can someone summarize the importance of understanding energy transitions?
Understanding energy transitions helps predict atomic behavior and the emission and absorption of light in various atoms!
Excellent! You've all done a great job today; understanding these transitions is key to grasping the fundamentals of atomic and quantum physics.
Introduction & Overview
Read summaries of the section's main ideas at different levels of detail.
Quick Overview
Standard
Bohr's model of the hydrogen atom demonstrates that energy absorption and emission occur when an electron transitions between fixed orbits (quantized energy levels), resulting in the unique line spectrum of hydrogen. The energy differences between these orbits correspond to the wavelengths of emitted or absorbed light.
Detailed
Detailed Explanation of the Line Spectrum of Hydrogen
The line spectrum observed in the case of the hydrogen atom results from the transitions of electrons between quantized energy levels described by Bohr's model. In a hydrogen atom, electrons can exist in specific energy states or orbits, which are identified by their principal quantum numbers (n). When energy is absorbed, an electron moves to a higher orbit (n_f > n_i), while energy is emitted when it transitions from a higher energy state to a lower one (n_i > n_f). The difference in energy for transitions between these orbits is given by the equation:
\[ \Delta E = E_f - E_i \]
where \(E_f\) and \(E_i\) are the energies of the final and initial orbits, respectively.
Using this principle, the emitted or absorbed energy can also be related to frequency \((
u)\) using Planck's equation,
\[ E = h
u \]
where \(h\) is Planck's constant. Furthermore, Rydberg’s formula empirically describes the wavelengths of transitions:
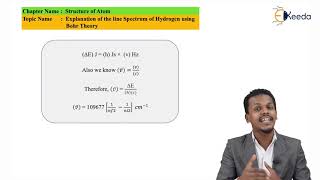
\[ \nu = R_H \left( \frac{1}{{n_1}^2} - \frac{1}{{n_2}^2} \right) \]
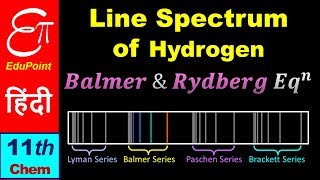
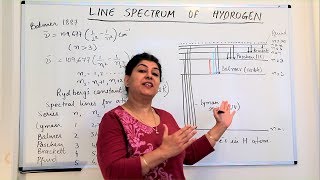
where \(R_H\) is the Rydberg constant and n1 and n2 are integers representing the principal quantum numbers. The line spectrum emerges from several transitions in the hydrogen atom, resulting in bright lines at specific wavelengths, thus allowing for different series of spectral lines such as the Balmer series, which is uniquely visible.
Youtube Videos


Audio Book
Dive deep into the subject with an immersive audiobook experience.
Energy Absorption and Emission
Chapter 1 of 5
🔒 Unlock Audio Chapter
Sign up and enroll to access the full audio experience
Chapter Content
Line spectrum observed in case of hydrogen atom, as mentioned in section 2.3.3, can be explained quantitatively using Bohr’s model. According to assumption 2, radiation (energy) is absorbed if the electron moves from the orbit of smaller Principal quantum number to the orbit of higher Principal quantum number, whereas the radiation (energy) is emitted if the electron moves from higher orbit to lower orbit.
Detailed Explanation
Bohr's model describes how electrons in a hydrogen atom can only exist in specific energy states. When an electron absorbs energy, it jumps to a higher energy state (orbit). Conversely, when the electron releases energy, it falls back to a lower energy state, emitting a photon of light. This behavior directly explains the hydrogen spectrum, which shows distinct lines corresponding to energy transitions.
Examples & Analogies
Think of a playground slide. When a child climbs to the top (higher energy state), it's like an electron absorbing energy. When they slide down (lower energy state), they release energy, akin to an electron emitting a photon. The specific heights of the slide represent the quantized energy levels.
Energy Gap and Transition
Chapter 2 of 5
🔒 Unlock Audio Chapter
Sign up and enroll to access the full audio experience
Chapter Content
The energy gap between the two orbits is given by equation (2.16) ∆E = Ef – Ei.
Detailed Explanation
The difference in energy (∆E) between two orbits (or energy levels) can be calculated by subtracting the energy of the lower level (Ei) from that of the higher level (Ef). This quantifies the amount of energy absorbed or emitted during transitions between these stable states.
Examples & Analogies
Imagine you have two steps in your house. Moving from the lower step to the higher step requires effort (energy). When you jump down to the lower step, potential energy is released. Similarly, electrons require energy to move up or release energy to come down between their defined orbits.
Calculating Frequency of Photon
Chapter 3 of 5
🔒 Unlock Audio Chapter
Sign up and enroll to access the full audio experience
Chapter Content
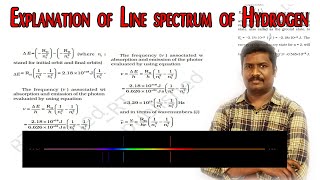
The frequency (ν) associated with the absorption and emission of the photon can be evaluated by using equation (2.18).
Detailed Explanation
When an electron transitions between two energy states, the frequency of the photon emitted or absorbed can be calculated, relating directly to that energy difference. This frequency is crucial in identifying the specific wavelengths of light observed in the hydrogen spectrum.
Examples & Analogies
Consider a musician playing different notes on a guitar. Each string produces a specific frequency of sound depending on how tight it is pulled (energy state). Similarly, an electron emits or absorbs specific frequencies of light, akin to musical notes when transitioning between energy levels.
Rydberg's Formula
Chapter 4 of 5
🔒 Unlock Audio Chapter
Sign up and enroll to access the full audio experience
Chapter Content
The expression (2.17) is similar to that used by Rydberg (2.9) derived empirically using the experimental data available at that time.
Detailed Explanation
Rydberg discovered a formula that could predict the wavelengths of spectral lines in hydrogen. This empirical relationship ties the observed wavelengths to the transitions between different energy levels, hence reinforcing Bohr's theoretical model with experimental data.
Examples & Analogies
Think of Rydberg's work as creating a map for a treasure hunt. Just like a map guides treasure seekers to specific locations based on clues, Rydberg's formula gives scientists precise wavelengths to look for based on observed transitions in hydrogen.
Spectral Lines and Their Meaning
Chapter 5 of 5
🔒 Unlock Audio Chapter
Sign up and enroll to access the full audio experience
Chapter Content
The brightness or intensity of spectral lines depends upon the number of photons of the same wavelength or frequency absorbed or emitted.
Detailed Explanation
The intensity of each line in the hydrogen spectrum corresponds to how many photons are emitted or absorbed during electron transitions. More photons result in brighter lines, which aids in determining the concentration of hydrogen in a sample.
Examples & Analogies
Visualize a concert where the intensity of sound depends on the number of instruments playing. If more instruments (photons) are involved, the sound (spectral line intensity) becomes stronger. This illustrates how higher photon counts lead to brighter spectral lines.
Key Concepts
-
Quantized Energy Levels: Electrons can only occupy certain energy levels in an atom.
-
Rydberg Formula: It relates the wavelengths of light emitted during electronic transitions in hydrogen.
Examples & Applications
The emission spectrum of hydrogen shows distinct lines such as the Balmer series, identifiable in the visible spectrum.
Memory Aids
Interactive tools to help you remember key concepts
Rhymes
Hydrogen's bright lines show us distinct emissions, helping us learn about energy transitions.
Stories
Imagine a dancer, each step she takes represents an electron's move between energy levels, creating a beautiful light show in the sky each time she jumps.
Memory Tools
Remember Rydberg's formula as 'N1 to N2 breeds brilliance!' for transitions that yield light.
Acronyms
B.E.B - Bohr's Electron Balancing, for understanding how electrons balance energy in their orbits.
Flash Cards
Glossary
- Line Spectrum
A spectrum consisting of discrete lines representing specific wavelengths of emitted or absorbed light from an atom.
- Bohr Model
A model describing the atom as having quantized energy levels where electrons orbit the nucleus at fixed distances.
- Quantized Energy Levels
Energy states that electrons can occupy, limited to specific values determined by the atom's structure.
- Rydberg Constant
A constant used in the Rydberg formula that relates to the wavelengths of spectral lines in hydrogen.
- Wavenumber
The number of wavelengths per unit length, often expressed in cm⁻¹, inversely related to the wavelength.
Reference links
Supplementary resources to enhance your learning experience.