
Master Curves
Enroll to start learning
You’ve not yet enrolled in this course. Please enroll for free to listen to audio lessons, classroom podcasts and take practice test.
Interactive Audio Lesson
Listen to a student-teacher conversation explaining the topic in a relatable way.
Understanding Master Curves
🔒 Unlock Audio Lesson
Sign up and enroll to listen to this audio lesson

Today, we're going to discuss master curves. Can someone tell me what they think a master curve might represent in the context of bituminous materials?

Is it something that relates to how strong a material is under different conditions?
Exactly! Master curves plot modulus against frequency across different temperatures, showing how materials behave. It's a key tool for predicting performance.

So, it's not just about strength but also about how the material responds over time?
Correct! This brings us to the Time-Temperature Superposition Principle, which helps us understand the long-term behavior of bituminous mixes. Can anyone guess why that might be important?

Maybe because roads go through different weather conditions?
That's right! Understanding these responses helps us design better pavements. Now, let’s summarize: master curves help visualize material response over time and under varying temperatures.
Application of Master Curves
🔒 Unlock Audio Lesson
Sign up and enroll to listen to this audio lesson

Let’s dive deeper into how we apply master curves. Why do you think engineers rely on these plots?

They probably want to predict how long the pavement will last.
Exactly! By understanding how a bituminous mix behaves, they can forecast its performance and lifespan. Can anyone think of specific conditions affecting these curves?
Temperature changes or traffic load can alter its behavior?
Great point! Conditions like these must be considered in the design phase. Remember the acronym STAND for the factors affecting master curves—Stiffness, Temperature, Ageing, Nature of materials, and Degree of loading. Can anyone expand on how one of these factors might affect the behavior?
If it gets too hot, will the material become too soft?
Right again! It's crucial for engineers to understand this to avoid premature pavement failures. In summary, master curves are vital for accurately predicting material performance in real-life conditions.
Time-Temperature Superposition Principle
🔒 Unlock Audio Lesson
Sign up and enroll to listen to this audio lesson
Today, let’s discuss the Time-Temperature Superposition Principle that works hand in hand with master curves. Who can explain what that means?
I think it’s about predicting how materials act over time based on shorter tests?
Exactly! It allows us to infer how bituminous mixes behave over long durations by performing quick tests at various temperatures. Why is this efficient?
Because it saves time and resources by avoiding extensive long-term testing?
Correct! It streamlines the process. Let's remember the acronym TIME—Testing, Intensity, Modulus, and Exposure. Can anyone state how the principle impacts design decisions?
It helps choose the right materials for different climates!
Exactly! It ensures the pavements perform well regardless of environmental conditions. To wrap up, the Time-Temperature Superposition Principle enhances the practical application of our master curves in pavement design.
Introduction & Overview
Read summaries of the section's main ideas at different levels of detail.
Quick Overview
Standard
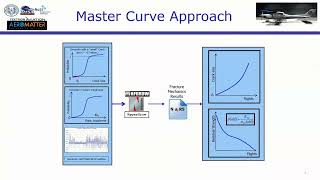
This section discusses master curves, which graphically illustrate the relationship between modulus and frequency at various temperatures for bituminous mixes. They are crucial for understanding the material's behavior and predict its performance under different environmental conditions.
Detailed
Detailed Summary
Master Curves in Bituminous Mixes
Master curves represent a significant aspect of understanding the rheological properties of bituminous mixes. They are graphical plots that showcase the relationship between the modulus (which reflects the stiffness of the material) and the frequency of loading over a wide range of temperatures. This approach allows engineers to effectively model the performance of bituminous materials used in pavement under realistic conditions.
Significance
The use of master curves supports the application of the Time-Temperature Superposition Principle, enabling predictions of the mix's behavior during lengthy service periods based on short-term tests. This is vital for aware pavement design, as it helps predict how materials will respond to various loading and temperature scenarios over time.
Youtube Videos


Audio Book
Dive deep into the subject with an immersive audiobook experience.
Introduction to Master Curves
Chapter 1 of 1
🔒 Unlock Audio Chapter
Sign up and enroll to access the full audio experience
Chapter Content
• Plot of modulus vs. frequency over a range of temperatures.
• Used to model performance under real-life conditions.
Detailed Explanation
Master curves are graphical representations that combine multiple sets of data about the behavior of materials, specifically how modulus (a measure of stiffness) changes with frequency at different temperatures. The modulus indicates how much a material opposes deformation when a load is applied. When we plot modulus against frequency, we can see how the stiffness of bituminous mixes varies. This plotting helps engineers design pavements that can withstand different conditions encountered in real life, such as traffic loads and varying temperatures.
Examples & Analogies
Imagine you have a rubber band. When you stretch it slowly, it feels one way, but if you yank it quickly, it feels stiffer. Master curves are like capturing both of those sensations at once—showing how the rubber band (or bituminous mix) behaves under different speeds of stretching (frequency) and temperatures. This understanding helps engineers ensure that the pavement will perform well no matter the traffic speed or weather condition.
Key Concepts
-
Master Curves: Plots of modulus vs. frequency at different temperatures, essential for understanding bituminous mix behavior.
-
Time-Temperature Superposition Principle: A method to predict material behavior over time based on short-term tests.
Examples & Applications
Example of using a master curve might be illustrating how the modulus of asphalt increases as frequency of loading decreases at different temperatures.
In practice, engineers might utilize master curves to determine the best mixture design for regions with varied climate conditions.
Memory Aids
Interactive tools to help you remember key concepts
Rhymes
Master curves on a chart, show modulus and frequency's part.
Stories
Imagine a road engineer consulting a magical chart that displays how asphalt behaves over time and temperature—this chart is the master curve, guiding them in their design choices.
Memory Tools
Remember MOD-FF: Modulus on the x-axis, Over time, and Frequency on the y-axis—the key components to mastering curves.
Acronyms
STAND for factors affecting master curves
Stiffness
Temperature
Ageing
Nature of materials
and Degree of loading.
Flash Cards
Glossary
- Master Curves
Graphical plots that show the relationship between the modulus of bituminous mixes and frequency over a range of temperatures.
- TimeTemperature Superposition Principle
A principle that allows prediction of material behavior over long periods using short-term test results.
- Modulus
A measure of the stiffness of a material in response to stress.
- Rheology
The study of flow and deformation of materials.
Reference links
Supplementary resources to enhance your learning experience.